U.S. Asylum Statistics 2026: Grant Rates, Denials and the Backlog
How asylum decisions in immigration court and at USCIS asylum offices have changed since 2016, what a grant rate actually measures, and where the applications are waiting.
- Published
- Updated
- Compiled by
- Ace Immigration, the law firm of attorney Anna Tsibel
- License
- CC BY 4.0 — free to republish with credit
Data: EOIR data generated July 24, 2026 (FY2026 through June 30, 2026); USCIS quarterly data through June 30, 2026; DHS Yearbook 2024. Files retrieved October 31, 2026.
Key figures
7.5%
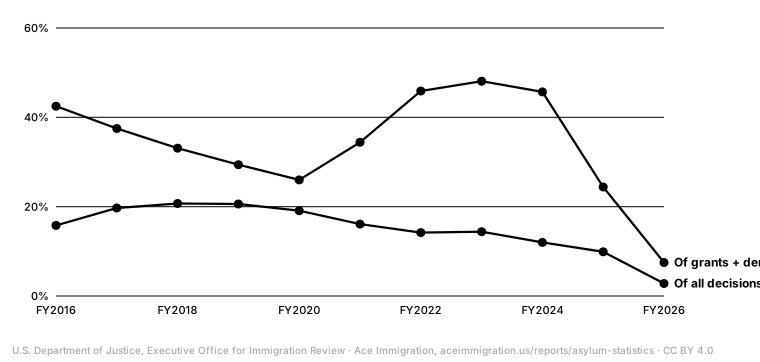
of immigration court asylum decisions that were a grant or a denial went the applicant's way in the first nine months of FY2026, down from 24.4% in FY2025 and 45.7% in FY2024
U.S. Department of Justice, July 24, 202689,740
asylum denials by immigration judges from October 2025 to June 2026, already more than in any full year before
U.S. Department of Justice, July 24, 20263.7M
asylum applications waiting on June 30, 2026: 2.3M in immigration court and 1.4M at USCIS asylum offices
U.S. Department of Justice, July 24, 202668,170
people were granted asylum in FY2024, the most in the Yearbook series since 1990; 35,840 at USCIS and 32,330 in court
U.S. Department of Homeland Security, August 2026
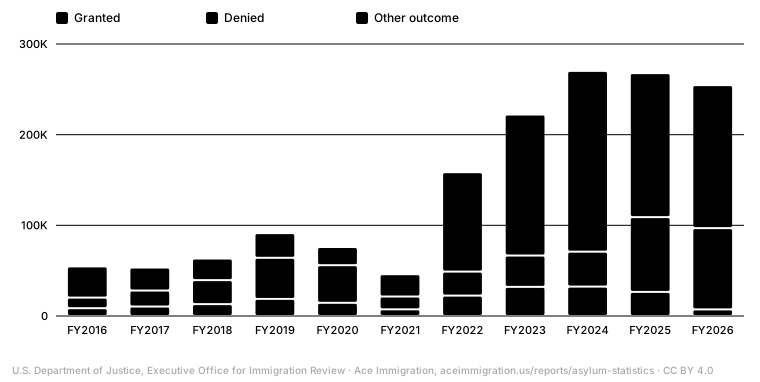
Immigration court: grants fell to 7,231 while denials reached 89,740
In the first nine months of FY2026 (October 1, 2025 to June 30, 2026), immigration judges granted asylum in 7,231 cases and denied it in 89,740. In all of FY2025 they granted 26,599 and denied 82,431; in FY2024, 32,436 and 38,529 (U.S. Department of Justice, Executive Office for Immigration Review). Grants in nine months of FY2026 are 78% below the full FY2024 figure.
Source: EOIR Adjudication Statistics: Asylum Decisions, data generated July 24, 2026Affirmative and defensive applications decided in completed removal, deportation, exclusion and asylum-only proceedings (initial completions).
Show the data
| Fiscal year | Granted | Denied | Abandoned | Not adjudicated | Withdrawn | Admin. closure | Total |
|---|---|---|---|---|---|---|---|
| FY2016 | 8,651 | 11,689 | 2,157 | 6,234 | 4,418 | 21,560 | 54,709 |
| FY2017 | 10,524 | 17,575 | 3,502 | 5,719 | 5,334 | 10,886 | 53,540 |
| FY2018 | 13,134 | 26,499 | 5,524 | 8,835 | 7,389 | 2,092 | 63,473 |
| FY2019 | 18,865 | 45,294 | 8,971 | 8,065 | 10,107 | 132 | 91,434 |
| FY2020 | 14,570 | 41,471 | 6,493 | 5,883 | 7,230 | 480 | 76,127 |
| FY2021 | 7,403 | 14,117 | 2,266 | 14,209 | 5,182 | 2,936 | 46,113 |
| FY2022 | 22,501 | 26,490 | 7,397 | 72,242 | 9,713 | 20,258 | 158,601 |
| FY2023 | 32,073 | 34,634 | 13,324 | 109,309 | 12,968 | 19,955 | 222,263 |
| FY2024 | 32,436 | 38,529 | 18,444 | 145,741 | 14,456 | 20,707 | 270,313 |
| FY2025 | 26,599 | 82,431 | 51,654 | 78,243 | 15,120 | 13,875 | 267,922 |
| FY2026 (9 mo.) | 7,231 | 89,740 | 92,081 | 44,062 | 18,251 | 3,315 | 254,680 |
Two other outcomes grew even faster. Applications recorded as abandoned rose from 18,444 in FY2024 to 92,081 in nine months of FY2026, and withdrawals from 14,456 to 18,251. Applications not adjudicated at all, usually because the case ended in an in absentia removal order, were 44,062. Of the 254,680 asylum decisions recorded in FY2026 so far, only 2.8% were grants.
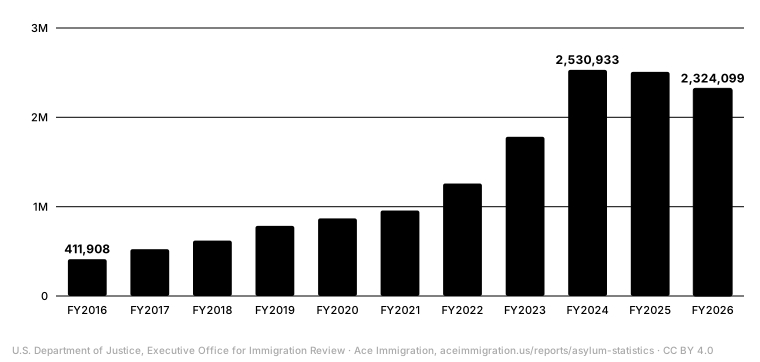
Where applications wait: 2.3 million in court, 1.4 million at USCIS
On June 30, 2026, 2,324,099 asylum applications were pending in immigration court, down from 2,530,933 at the end of FY2024 but still +464% above FY2016 (U.S. Department of Justice, Executive Office for Immigration Review). USCIS asylum offices held another 1,392,782 affirmative applications on the same date (USCIS).
Source: EOIR Adjudication Statistics: Total Asylum Applications, data generated July 24, 2026
Show the data
| Fiscal year | Affirmative filed | Defensive filed | Total filed | Pending at year end |
|---|---|---|---|---|
| FY2016 | 12,676 | 70,995 | 83,671 | 411,908 |
| FY2017 | 22,017 | 124,787 | 146,804 | 524,189 |
| FY2018 | 48,663 | 117,855 | 166,518 | 620,623 |
| FY2019 | 61,718 | 155,787 | 217,505 | 784,622 |
| FY2020 | 39,551 | 159,698 | 199,249 | 868,911 |
| FY2021 | 22,938 | 66,966 | 89,904 | 957,556 |
| FY2022 | 23,424 | 244,108 | 267,532 | 1,259,816 |
| FY2023 | 12,765 | 503,164 | 515,929 | 1,781,532 |
| FY2024 | 11,709 | 901,008 | 912,717 | 2,530,933 |
| FY2025 | 40,837 | 838,766 | 879,603 | 2,508,982 |
| FY2026 (9 mo.) | 69,852 | 129,217 | 199,069 | 2,324,099 |
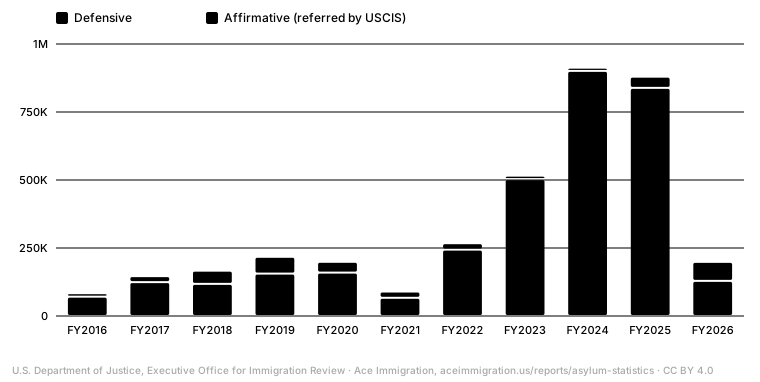
Filings in court have shifted. Defensive applications peaked at 901,008 in FY2024 and ran at 129,217 in the first nine months of FY2026, while affirmative applications referred by USCIS rose to 69,852, the highest figure in the series, as asylum offices resumed interviews and referred cases they did not grant.
Source: EOIR Adjudication Statistics: Total Asylum Applications, data generated July 24, 2026
Show the data
| Fiscal year | Defensive | Affirmative | Total |
|---|---|---|---|
| FY2016 | 70,995 | 12,676 | 83,671 |
| FY2017 | 124,787 | 22,017 | 146,804 |
| FY2018 | 117,855 | 48,663 | 166,518 |
| FY2019 | 155,787 | 61,718 | 217,505 |
| FY2020 | 159,698 | 39,551 | 199,249 |
| FY2021 | 66,966 | 22,938 | 89,904 |
| FY2022 | 244,108 | 23,424 | 267,532 |
| FY2023 | 503,164 | 12,765 | 515,929 |
| FY2024 | 901,008 | 11,709 | 912,717 |
| FY2025 | 838,766 | 40,837 | 879,603 |
| FY2026 (9 mo.) | 129,217 | 69,852 | 199,069 |
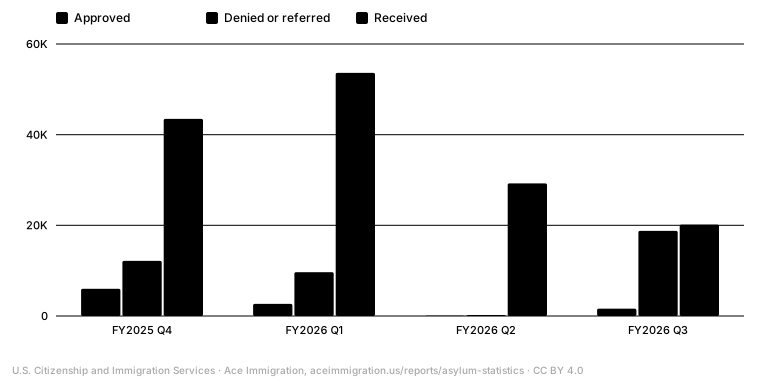
USCIS asylum offices: 66 approvals in one quarter
USCIS approved 5,996 affirmative asylum applications in July to September 2025, 2,666 in October to December, 66 in January to March 2026 and 1,620 in April to June 2026, while denials and referrals to immigration court, which USCIS counts together for this form, ran between 215 and 18,779 a quarter. New applications fell from 43,480 to 20,159 a quarter over the same year (USCIS all-forms reports). The January to March figure is low enough to suggest a processing pause rather than a change in standards; USCIS has not explained it.
Source: USCIS: All USCIS Application and Petition Form Types, FY2026 Q3USCIS's 'denied' column for affirmative I-589s includes applicants found not eligible on the merits and referred to an immigration judge; completions also include dismissals and other dispositions. USCIS reports no processing time for Form I-589.
Show the data
| Quarter | Received | Approved | Denied or referred | All completions | Pending |
|---|---|---|---|---|---|
| July 1, 2025 - September 30, 2025 | 43,480 | 5,996 | 12,150 | 116,795 | 1,435,560 |
| October 1, 2025 - December 31, 2025 | 53,633 | 2,666 | 9,670 | 76,786 | 1,418,576 |
| January 1, 2026 - March 31, 2026 | 29,261 | 66 | 215 | 43,414 | 1,414,955 |
| April 1, 2026 - June 30, 2026 | 20,159 | 1,620 | 18,779 | 47,654 | 1,392,782 |
For the whole of FY2024, by contrast, USCIS granted 18,040 affirmative cases, denied 420, referred 5,430 to immigration court and closed 105,200 (DHS OHSS). The asylum office denies few cases outright; its usual negative outcome is a referral, which starts the court process counted above.
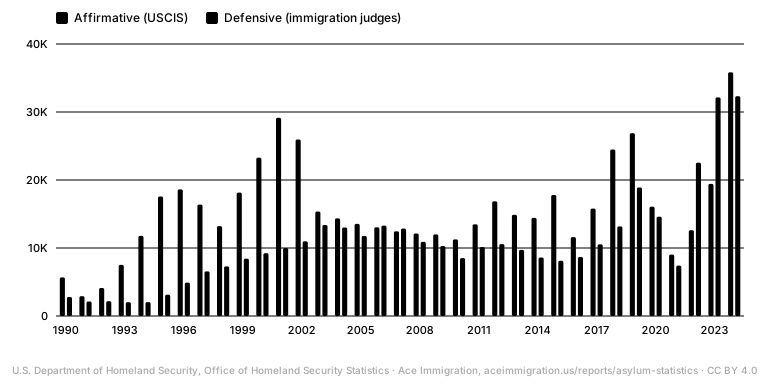
Who gets asylum: 68,170 people in FY2024, the most since 1990
Counting people rather than applications, the DHS Yearbook records 68,170 individuals granted asylum in FY2024: 35,840 by USCIS asylum offices and 32,330 by immigration judges. That is +245% above 2010 and +314% above the pandemic low of 16,450 in FY2021 (U.S. Department of Homeland Security, Office of Homeland Security Statistics). The FY2025 and FY2026 court figures above show the turn that came next.
Source: Yearbook of Immigration Statistics 2024, Table 16, data generated August 2026Persons, not applications: a grant covers the principal applicant and derivatives. OHSS rounds to the nearest 10.
Show the data
| Fiscal year | Affirmative | Defensive | Total |
|---|---|---|---|
| 1990 | 5,670 | 2,800 | 8,470 |
| 1991 | 2,910 | 2,130 | 5,040 |
| 1992 | 4,120 | 2,180 | 6,310 |
| 1993 | 7,510 | 2,030 | 9,540 |
| 1994 | 11,780 | 2,050 | 13,830 |
| 1995 | 17,570 | 3,130 | 20,700 |
| 1996 | 18,620 | 4,910 | 23,530 |
| 1997 | 16,380 | 6,560 | 22,940 |
| 1998 | 13,220 | 7,290 | 20,510 |
| 1999 | 18,150 | 8,420 | 26,570 |
| 2000 | 23,280 | 9,240 | 32,510 |
| 2001 | 29,150 | 10,000 | 39,150 |
| 2002 | 25,960 | 10,980 | 36,940 |
| 2003 | 15,370 | 13,380 | 28,740 |
| 2004 | 14,350 | 13,020 | 27,380 |
| 2005 | 13,550 | 11,760 | 25,300 |
| 2006 | 13,050 | 13,300 | 26,350 |
| 2007 | 12,460 | 12,860 | 25,320 |
| 2008 | 12,130 | 10,890 | 23,020 |
| 2009 | 12,000 | 10,300 | 22,300 |
| 2010 | 11,260 | 8,520 | 19,780 |
| 2011 | 13,490 | 10,140 | 23,630 |
| 2012 | 16,870 | 10,580 | 27,450 |
| 2013 | 14,880 | 9,720 | 24,600 |
| 2014 | 14,420 | 8,600 | 23,020 |
| 2015 | 17,800 | 8,120 | 25,920 |
| 2016 | 11,610 | 8,670 | 20,280 |
| 2017 | 15,800 | 10,540 | 26,340 |
| 2018 | 24,480 | 13,170 | 37,650 |
| 2019 | 26,880 | 18,890 | 45,780 |
| 2020 | 16,080 | 14,600 | 30,680 |
| 2021 | 9,030 | 7,410 | 16,450 |
| 2022 | 12,620 | 22,540 | 35,160 |
| 2023 | 19,420 | 32,140 | 51,550 |
| 2024 | 35,840 | 32,330 | 68,170 |
Grants by nationality, including Russia, Ukraine, Belarus and Central Asia, are in the companion report Asylum Outcomes for Russians, Ukrainians, Belarusians and Central Asians.
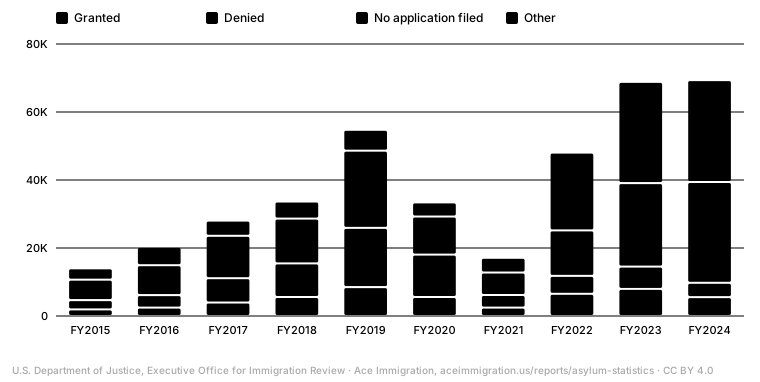
Border cases: four in ten never file the application
Of the 69,393 completed court cases in FY2024 that began with a credible fear referral at the border, 29,655 (42.7%) ended with no asylum application ever filed, 23,626 ended without the application being decided, and 5,563 were granted against 4,191 denied (U.S. Department of Justice, Executive Office for Immigration Review). Among decisions on the merits, 57.0% were grants; among all outcomes, 8.0%.
Source: EOIR Adjudication Statistics: Asylum Decisions in Cases Originating with a Credible Fear Claim, data generated October 10, 2024
Show the data
| Fiscal year | Granted | Denied | No application filed | Abandoned | Not adjudicated | Withdrawn | Admin. closure | Total |
|---|---|---|---|---|---|---|---|---|
| FY2015 | 1,946 | 2,724 | 6,007 | 343 | 0 | 594 | 2,050 | 14,030 |
| FY2016 | 2,463 | 3,679 | 8,802 | 446 | 0 | 712 | 3,680 | 20,319 |
| FY2017 | 3,967 | 7,139 | 12,480 | 920 | 3 | 959 | 1,915 | 28,060 |
| FY2018 | 5,582 | 9,880 | 13,195 | 1,586 | 426 | 1,257 | 339 | 33,685 |
| FY2019 | 8,494 | 17,424 | 22,705 | 2,446 | 965 | 2,202 | 17 | 54,759 |
| FY2020 | 5,584 | 12,470 | 11,220 | 1,338 | 1,355 | 1,302 | 140 | 33,412 |
| FY2021 | 2,458 | 3,733 | 6,597 | 457 | 2,735 | 527 | 619 | 17,129 |
| FY2022 | 6,520 | 5,268 | 13,384 | 1,468 | 16,708 | 1,023 | 3,675 | 48,051 |
| FY2023 | 7,969 | 6,554 | 24,558 | 2,530 | 22,052 | 1,844 | 3,335 | 68,848 |
| FY2024 | 5,563 | 4,191 | 29,655 | 2,193 | 23,626 | 1,900 | 2,261 | 69,393 |
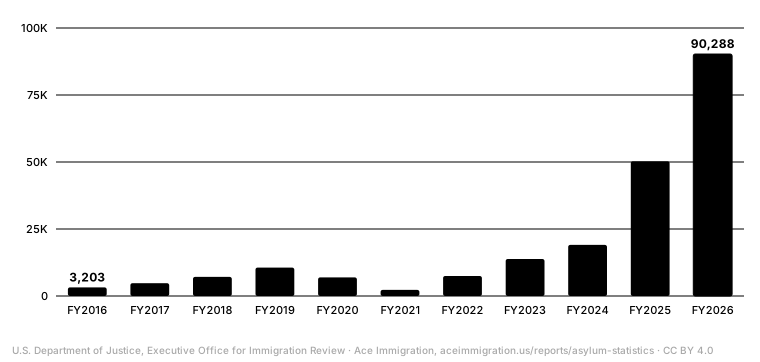
In absentia orders against asylum applicants followed the same path: 3,203 in FY2016, 50,254 in FY2025 and 90,288 in the first nine months of FY2026 (U.S. Department of Justice, Executive Office for Immigration Review).
Source: EOIR Adjudication Statistics: Asylum Applicant In Absentia Removal Orders, data generated July 24, 2026
Show the data
| Fiscal year | In absentia orders | Per month |
|---|---|---|
| FY2016 | 3,203 | 267 |
| FY2017 | 4,794 | 400 |
| FY2018 | 7,113 | 593 |
| FY2019 | 10,585 | 882 |
| FY2020 | 6,955 | 580 |
| FY2021 | 2,282 | 190 |
| FY2022 | 7,470 | 623 |
| FY2023 | 13,788 | 1,149 |
| FY2024 | 19,069 | 1,589 |
| FY2025 | 50,254 | 4,188 |
| FY2026 (9 mo.) | 90,288 | 10,032 |
- 77% of asylum cases completed in FY2025 had a representative of record; the national figure for all completed cases was 55% (U.S. Department of Justice, Executive Office for Immigration Review).
- Court-level and judge-level figures, the backlog and in absentia orders for all case types are in U.S. Immigration Court Statistics 2026.
How to read these numbers
- Grant rate
- There is no official definition. This page states which denominator it uses each time: grants over grants plus denials (the share of merits decisions that succeeded), or grants over all decisions (including applications abandoned, withdrawn, not adjudicated or administratively closed). EOIR's own nationality tables use all decisions.
- Affirmative and defensive asylum
- An affirmative application is filed with USCIS by someone not in removal proceedings; if the asylum office does not grant it, the case is usually referred to immigration court. A defensive application is filed in immigration court as a defense to removal.
- Not adjudicated, abandoned, withdrawn
- A case can end without a decision on the asylum application: the judge orders removal without reaching it (often in absentia), the applicant misses a filing deadline (abandoned), or withdraws it. These are counted as decisions in EOIR's tables but are not denials on the merits.
- Credible fear referral
- A person who expresses fear at the border is screened by an asylum officer; a positive finding sends the case to immigration court, where an asylum application still has to be filed and proved.
Sources and method
Every figure on this page comes from a file published by the U.S. government, retrieved October 31, 2026. The tables were extracted from the original PDF and Excel files by scripts that check each table against the totals printed in the same file (row sums, recomputed rates, fiscal-year sequences). Derived measures such as approval shares and year-over-year changes are computed from the published counts, and the formula is stated next to each one.
The federal fiscal year starts on October 1: FY2026 runs from October 1, 2025 to September 30, 2026. Partial years are marked. Agencies suppress small cells to protect privacy; those cells are shown as “—” and left out of sums, which explains small gaps against national totals.
- EOIR Adjudication Statistics: Asylum Decisions
U.S. Department of Justice, Executive Office for Immigration Review · data generated July 24, 2026 · agency page
- EOIR Adjudication Statistics: Total Asylum Applications
U.S. Department of Justice, Executive Office for Immigration Review · data generated July 24, 2026 · agency page
- USCIS: All USCIS Application and Petition Form Types, FY2025 Q4
U.S. Citizenship and Immigration Services · agency page
- USCIS: All USCIS Application and Petition Form Types, FY2026 Q1
U.S. Citizenship and Immigration Services · agency page
- USCIS: All USCIS Application and Petition Form Types, FY2026 Q2
U.S. Citizenship and Immigration Services · agency page
- USCIS: All USCIS Application and Petition Form Types, FY2026 Q3
U.S. Citizenship and Immigration Services · agency page
- Yearbook of Immigration Statistics 2024, Table 16
U.S. Department of Homeland Security, Office of Homeland Security Statistics · data generated August 2026 · agency page
- EOIR Adjudication Statistics: Asylum Decisions in Cases Originating with a Credible Fear Claim
U.S. Department of Justice, Executive Office for Immigration Review · data generated October 10, 2024 · agency page
- EOIR Adjudication Statistics: Asylum Applicant In Absentia Removal Orders
U.S. Department of Justice, Executive Office for Immigration Review · data generated July 24, 2026 · agency page
- EOIR Adjudication Statistics: Current Representation Rates
U.S. Department of Justice, Executive Office for Immigration Review · data generated November 18, 2025 · agency page
General information, not legal advice. Statistics describe groups of cases, not yours: an outcome depends on the facts, the evidence, the court and the governing law. Publication does not create an attorney-client relationship.
Preparing an asylum case, or already in court?
Many of the outcomes above are applications filed late, without evidence, or never filed at all. Tell us when you entered the United States and whether you have a hearing date; attorney Anna Tsibel handles affirmative and defensive asylum in English and Russian.
We take these cases: Asylum, Deportation and removal defense, Family and marriage-based immigration, K-1 fiancé(e) visa, I-751 removal of conditions and waivers, Inadmissibility waivers, VAWA self-petitions, Citizenship and naturalization.
(805) 409-9384