Marriage Green Card Statistics 2026: I-130, I-485, I-751 and K-1 Approval Rates and Wait Times
The family immigration pipeline in numbers: fiancé(e) petitions, spousal petitions, adjustment of status and the removal of conditions, from USCIS quarterly reports and the DHS Yearbook.
- Published
- Updated
- Compiled by
- Ace Immigration, the law firm of attorney Anna Tsibel
- License
- CC BY 4.0 — free to republish with credit
Data: USCIS quarterly reports FY2025 Q4 to FY2026 Q3 (through June 30, 2026); USCIS report to Congress for August 2026; DHS Yearbook 2024. Files retrieved October 31, 2026.
Key figures
83.2%
of immediate-relative I-130 decisions in April to June 2026 were approvals (82,636 approved, 16,661 denied); median wait 13.0 months
U.S. Citizenship and Immigration Services22.6 months
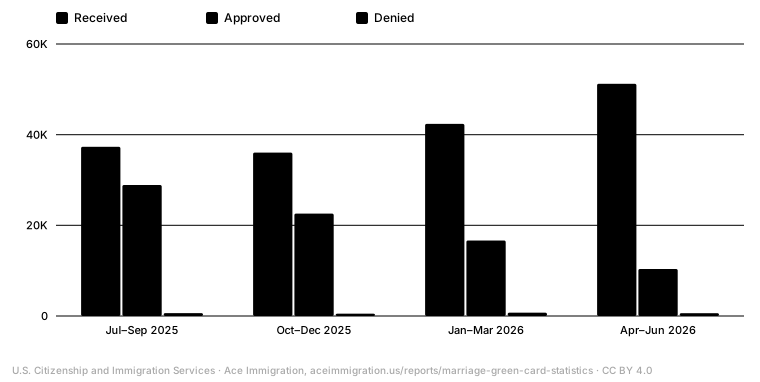
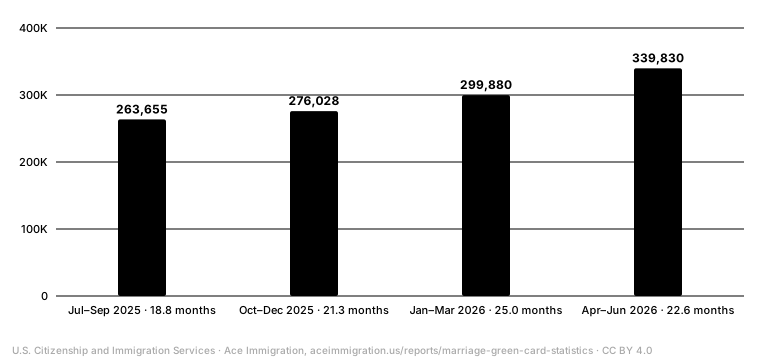
median I-751 processing time in April to June 2026, with 339,830 petitions pending and 94.3% of decisions approved
U.S. Citizenship and Immigration Services75.1%
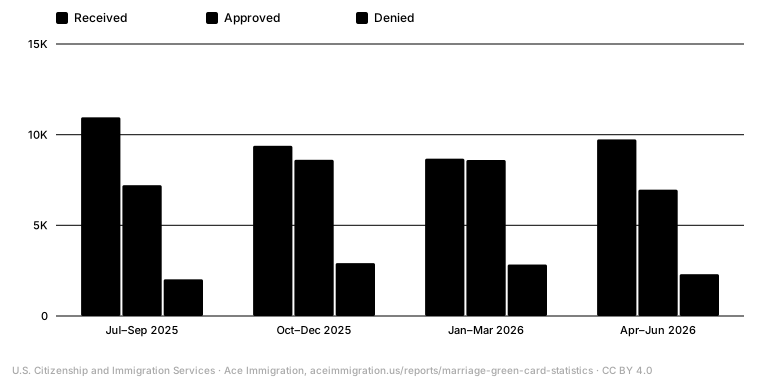
of K-1 fiancé(e) petition (I-129F) decisions were approvals in April to June 2026; one in four was denied
U.S. Citizenship and Immigration Services1,397,790
immediate-relative I-130 petitions and family-based I-485 applications pending on June 30, 2026 (786,723 and 611,067)
U.S. Citizenship and Immigration Services
I-130 for spouses: 83% approved, 13 months, 786,723 waiting
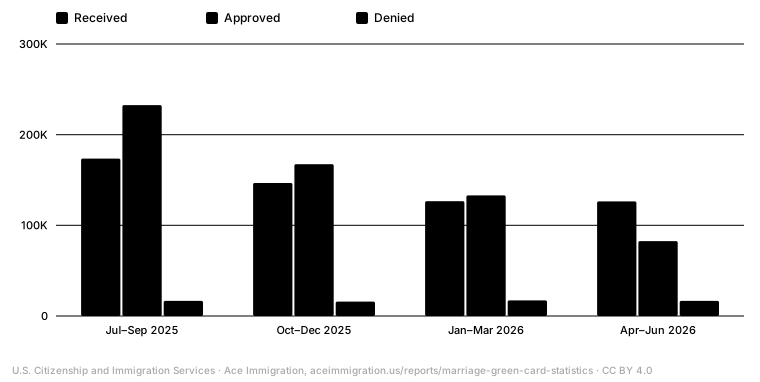
In April to June 2026 USCIS approved 82,636 immediate-relative petitions and denied 16,661, an approval share of 83.2%. Three quarters earlier, in July to September 2025, it approved 232,609 and denied 16,679 (93.3%). Approvals fell every quarter while denials stayed between 15,913 and 17,243, so the denial share grew mostly because fewer cases were approved, not because more were refused. The median wait was 13.0 months and 786,723 petitions were pending (USCIS).
Source: USCIS: All USCIS Application and Petition Form Types, FY2026 Q3Spouses, parents and unmarried children under 21 of U.S. citizens. Approval share = approved ÷ (approved + denied).
Show the data
| Quarter | Received | Approved | Denied | Approval share | Pending | Median months |
|---|---|---|---|---|---|---|
| July 1, 2025 - September 30, 2025 | 173,595 | 232,609 | 16,679 | 93.3% | 801,745 | 13.7 |
| October 1, 2025 - December 31, 2025 | 146,726 | 167,401 | 15,913 | 91.3% | 772,234 | 13.1 |
| January 1, 2026 - March 31, 2026 | 126,666 | 132,960 | 17,243 | 88.5% | 761,638 | 12.5 |
| April 1, 2026 - June 30, 2026 | 126,417 | 82,636 | 16,661 | 83.2% | 786,723 | 13 |
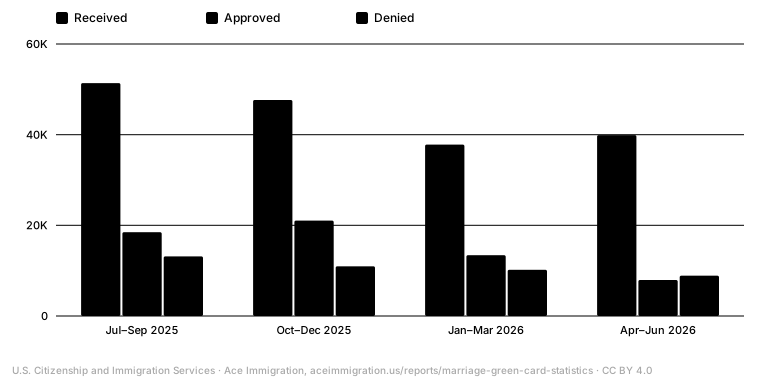
Preference-category petitions, for spouses and children of permanent residents and for adult children and siblings of citizens, tell a different story: 7,951 approved against 8,883 denied in the latest quarter, a median of 43.3 months, and 1,617,823 pending, awaiting a decision.
Source: USCIS: All USCIS Application and Petition Form Types, FY2026 Q3Spouses and children of permanent residents, adult children and siblings of citizens; these wait for a visa number after approval.
Show the data
| Quarter | Received | Approved | Denied | Approval share | Pending | Median months |
|---|---|---|---|---|---|---|
| July 1, 2025 - September 30, 2025 | 51,382 | 18,496 | 13,156 | 58.4% | 1,555,603 | 38 |
| October 1, 2025 - December 31, 2025 | 47,649 | 21,035 | 10,968 | 65.7% | 1,576,284 | 38 |
| January 1, 2026 - March 31, 2026 | 37,808 | 13,402 | 10,182 | 56.8% | 1,597,832 | 39.4 |
| April 1, 2026 - June 30, 2026 | 39,905 | 7,951 | 8,883 | 47.2% | 1,617,823 | 43.3 |
I-485 family-based adjustment: approvals down by two-thirds in a year
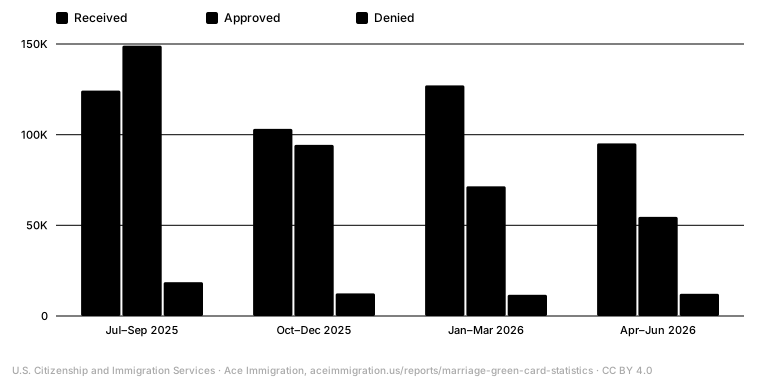
Family-based adjustment approvals went from 149,075 in July to September 2025 to 54,678 in April to June 2026, while denials went from 18,619 to 12,240; the approval share moved from 88.9% to 81.7%. Pending family-based applications rose from 543,486 to 611,067 and the median processing time from 6.0 months to 7.0 months (USCIS). USCIS's August 2026 report to Congress shows 449,160 family-based applications pending more than six months and an average of 12.4 months to a decision (USCIS).
Show the data
| Quarter | Received | Approved | Denied | Approval share | Pending | Median months |
|---|---|---|---|---|---|---|
| July 1, 2025 - September 30, 2025 | 124,297 | 149,075 | 18,619 | 88.9% | 543,486 | 6 |
| October 1, 2025 - December 31, 2025 | 103,187 | 94,355 | 12,455 | 88.3% | 536,170 | 5.3 |
| January 1, 2026 - March 31, 2026 | 127,189 | 71,514 | 11,689 | 86.0% | 579,684 | 5.9 |
| April 1, 2026 - June 30, 2026 | 95,175 | 54,678 | 12,240 | 81.7% | 611,067 | 7 |
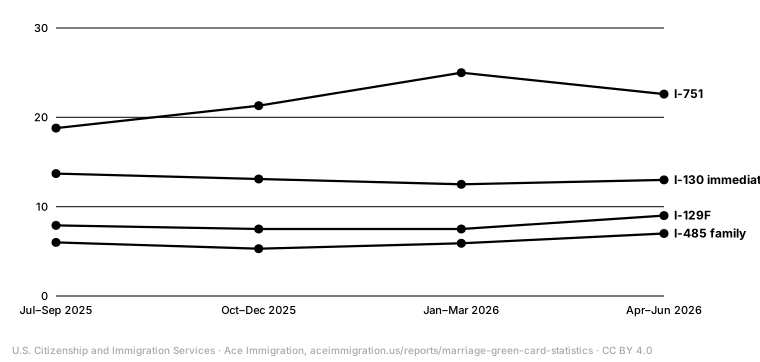
Source: USCIS: All USCIS Application and Petition Form Types, FY2026 Q3Median months from receipt to completion for cases completed in the quarter, as published by USCIS.
Show the data
| Quarter | I-751 | I-130 IR | I-129F | I-485 family |
|---|---|---|---|---|
| July 1, 2025 - September 30, 2025 | 18.8 | 13.7 | 7.9 | 6 |
| October 1, 2025 - December 31, 2025 | 21.3 | 13.1 | 7.5 | 5.3 |
| January 1, 2026 - March 31, 2026 | 25 | 12.5 | 7.5 | 5.9 |
| April 1, 2026 - June 30, 2026 | 22.6 | 13 | 9 | 7 |
I-751: 94% approved, but the queue grew to 339,830 and the wait to 22.6 months
Petitions to remove conditions on a two-year green card are approved far more often than they are denied: 10,368 approvals against 626 denials in April to June 2026 (94.3%), and 28,908 against 637 three quarters earlier. The problem is speed: approvals fell by 64% over those three quarters while receipts rose from 37,320 to 51,225 a quarter, so pending petitions climbed from 263,655 to 339,830 and the median processing time from 18.8 months to 22.6 months (USCIS). In August 2026 the average time to decision was 21.9 months and 268,379 petitions had been pending more than six months (USCIS).
Show the data
| Quarter | Received | Approved | Denied | Approval share | Pending | Median months |
|---|---|---|---|---|---|---|
| July 1, 2025 - September 30, 2025 | 37,320 | 28,908 | 637 | 97.8% | 263,655 | 18.8 |
| October 1, 2025 - December 31, 2025 | 36,050 | 22,593 | 497 | 97.8% | 276,028 | 21.3 |
| January 1, 2026 - March 31, 2026 | 42,372 | 16,645 | 727 | 95.8% | 299,880 | 25 |
| April 1, 2026 - June 30, 2026 | 51,225 | 10,368 | 626 | 94.3% | 339,830 | 22.6 |
Show the data
| Quarter | Pending | Median months |
|---|---|---|
| July 1, 2025 - September 30, 2025 | 263,655 | 18.8 |
| October 1, 2025 - December 31, 2025 | 276,028 | 21.3 |
| January 1, 2026 - March 31, 2026 | 299,880 | 25 |
| April 1, 2026 - June 30, 2026 | 339,830 | 22.6 |
K-1 fiancé(e) petitions: one in four denied
USCIS approved 6,966 Form I-129F petitions and denied 2,307 in April to June 2026 (75.1% approvals), after 8,612 and 2,919 in October to December 2025 (74.7%). The denial share, between 22% and 25% across the four quarters, is higher than for immediate-relative I-130, I-485 and I-751 petitions, though lower than for preference-category I-130s. The median processing time rose from 7.9 months to 9.0 months, with 35,871 petitions pending (USCIS).
Show the data
| Quarter | Received | Approved | Denied | Approval share | Pending | Median months |
|---|---|---|---|---|---|---|
| July 1, 2025 - September 30, 2025 | 10,958 | 7,214 | 2,025 | 78.1% | 38,599 | 7.9 |
| October 1, 2025 - December 31, 2025 | 9,385 | 8,612 | 2,919 | 74.7% | 36,875 | 7.5 |
| January 1, 2026 - March 31, 2026 | 8,676 | 8,604 | 2,839 | 75.2% | 34,676 | 7.5 |
| April 1, 2026 - June 30, 2026 | 9,737 | 6,966 | 2,307 | 75.1% | 35,871 | 9 |
By field office: Florida, California and the big cities
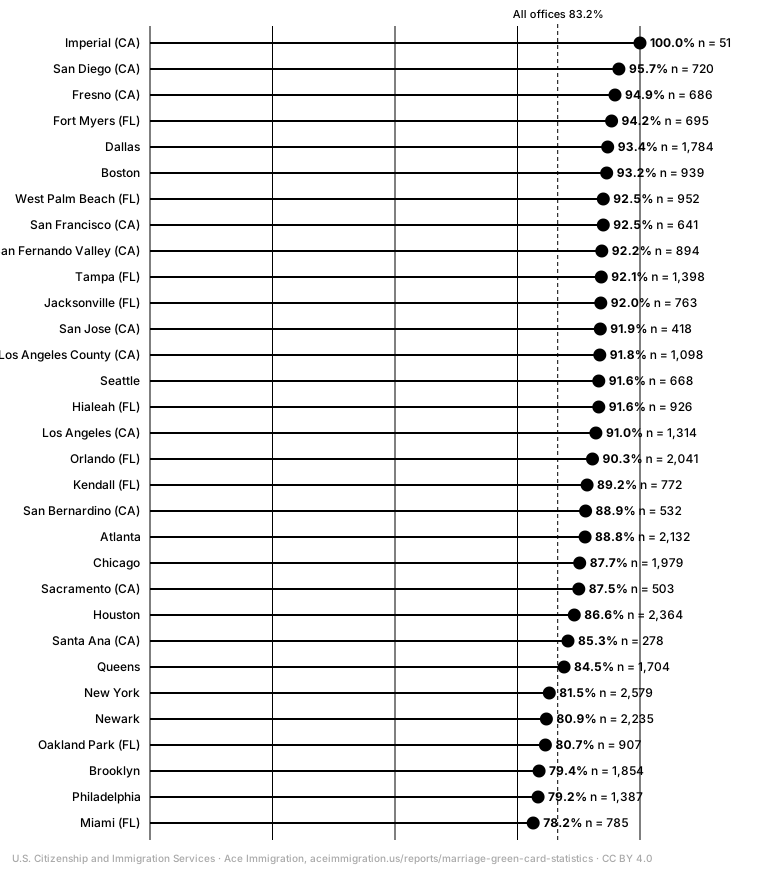
Among the Florida, California and major-city field offices shown here, the immediate-relative approval share in April to June 2026 ranged from 78.2% at Miami (FL) to 100.0% at Imperial (CA). In South Florida, Miami approved 614 and denied 171 (78.2%), Hialeah 848 and 78 (91.6%), and Oakland Park 732 and 175 (80.7%). Los Angeles approved 1,196 and denied 118 (91.0%) (USCIS).
Source: USCIS: Form I-130 by Category, Case Status and Field Office, FY2026 Q3Petitions decided at the field office in the quarter; most I-130s are decided at service centers, so office counts are small and shares swing from quarter to quarter.
Show the data
| Field office | Received | Approved | Denied | Approval share | Pending |
|---|---|---|---|---|---|
| Imperial (CA) | 474 | 51 | 0 | 100.0% | 2,212 |
| San Diego (CA) | 2,034 | 689 | 31 | 95.7% | 9,628 |
| Fresno (CA) | 1,457 | 651 | 35 | 94.9% | 7,894 |
| Fort Myers (FL) | 823 | 655 | 40 | 94.2% | 5,995 |
| Dallas | 5,279 | 1,667 | 117 | 93.4% | 27,103 |
| Boston | 2,327 | 875 | 64 | 93.2% | 14,761 |
| West Palm Beach (FL) | 1,377 | 881 | 71 | 92.5% | 10,074 |
| San Francisco (CA) | 1,925 | 593 | 48 | 92.5% | 11,250 |
| San Fernando Valley (CA) | 1,554 | 824 | 70 | 92.2% | 8,495 |
| Tampa (FL) | 2,042 | 1,288 | 110 | 92.1% | 14,102 |
| Jacksonville (FL) | 923 | 702 | 61 | 92.0% | 6,299 |
| San Jose (CA) | 1,895 | 384 | 34 | 91.9% | 9,826 |
| Los Angeles County (CA) | 2,117 | 1,008 | 90 | 91.8% | 10,867 |
| Seattle | 2,114 | 612 | 56 | 91.6% | 12,299 |
| Hialeah (FL) | 967 | 848 | 78 | 91.6% | 7,043 |
| Los Angeles (CA) | 2,145 | 1,196 | 118 | 91.0% | 10,815 |
| Orlando (FL) | 2,312 | 1,844 | 197 | 90.3% | 14,352 |
| Kendall (FL) | 874 | 689 | 83 | 89.2% | 7,788 |
| San Bernardino (CA) | 2,125 | 473 | 59 | 88.9% | 11,389 |
| Atlanta | 3,110 | 1,894 | 238 | 88.8% | 19,836 |
| Chicago | 4,018 | 1,735 | 244 | 87.7% | 21,803 |
| Sacramento (CA) | 1,576 | 440 | 63 | 87.5% | 8,912 |
| Houston | 5,048 | 2,048 | 316 | 86.6% | 29,859 |
| Santa Ana (CA) | 1,596 | 237 | 41 | 85.3% | 9,244 |
| Queens | 3,003 | 1,440 | 264 | 84.5% | 18,516 |
| New York | 3,646 | 2,101 | 478 | 81.5% | 20,182 |
| Newark | 3,481 | 1,809 | 426 | 80.9% | 20,807 |
| Oakland Park (FL) | 1,676 | 732 | 175 | 80.7% | 10,183 |
| Brooklyn | 2,846 | 1,472 | 382 | 79.4% | 16,766 |
| Philadelphia | 3,352 | 1,098 | 289 | 79.2% | 20,370 |
| Miami (FL) | 1,478 | 614 | 171 | 78.2% | 8,453 |
Naturalization decisions show the same local spread. Nationally, USCIS approved 54,974 civilian N-400 applications and denied 12,591 in the quarter (81.4%), with 727,371 pending (USCIS).
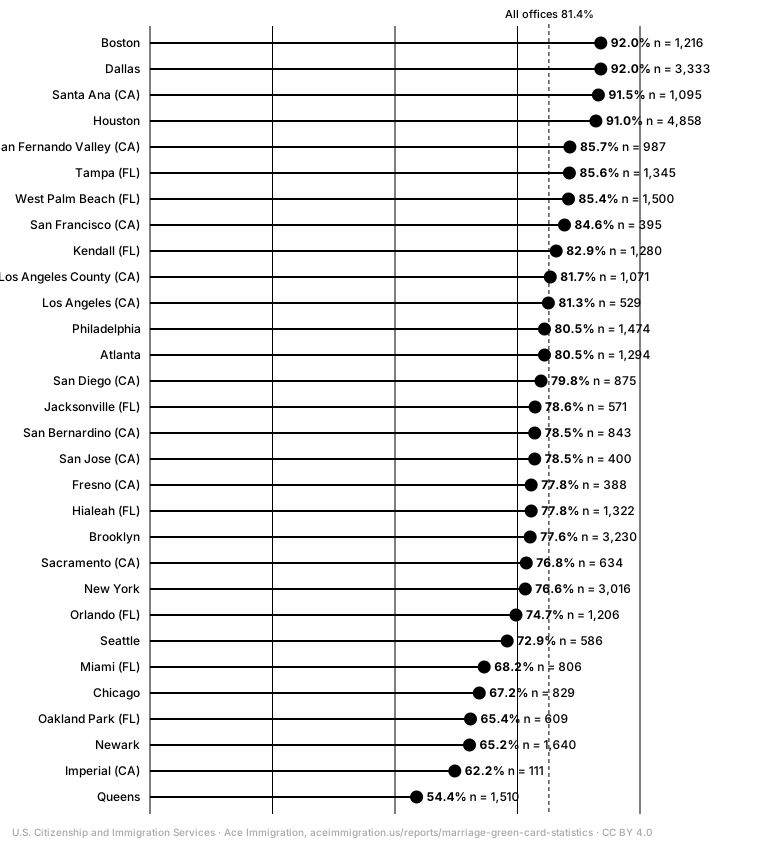
Show the data
| Field office | Received | Approved | Denied | Approval share | Pending |
|---|---|---|---|---|---|
| Boston | 2,677 | 1,119 | 97 | 92.0% | 17,310 |
| Dallas | 6,124 | 3,066 | 267 | 92.0% | 28,373 |
| Santa Ana (CA) | 2,303 | 1,002 | 93 | 91.5% | 14,011 |
| Houston | 5,516 | 4,423 | 435 | 91.0% | 30,883 |
| San Fernando Valley (CA) | 1,800 | 846 | 141 | 85.7% | 11,284 |
| Tampa (FL) | 2,378 | 1,151 | 194 | 85.6% | 16,281 |
| West Palm Beach (FL) | 1,402 | 1,281 | 219 | 85.4% | 7,231 |
| San Francisco (CA) | 3,207 | 334 | 61 | 84.6% | 18,595 |
| Kendall (FL) | 1,501 | 1,061 | 219 | 82.9% | 9,520 |
| Los Angeles County (CA) | 2,231 | 875 | 196 | 81.7% | 12,239 |
| Los Angeles (CA) | 2,502 | 430 | 99 | 81.3% | 11,662 |
| Philadelphia | 3,679 | 1,187 | 287 | 80.5% | 17,760 |
| Atlanta | 3,682 | 1,042 | 252 | 80.5% | 17,164 |
| San Diego (CA) | 1,952 | 698 | 177 | 79.8% | 11,886 |
| Jacksonville (FL) | 1,030 | 449 | 122 | 78.6% | 6,294 |
| San Bernardino (CA) | 2,034 | 662 | 181 | 78.5% | 12,291 |
| San Jose (CA) | 4,680 | 314 | 86 | 78.5% | 20,860 |
| Fresno (CA) | 1,349 | 302 | 86 | 77.8% | 9,658 |
| Hialeah (FL) | 1,544 | 1,028 | 294 | 77.8% | 8,885 |
| Brooklyn | 3,419 | 2,505 | 725 | 77.6% | 15,627 |
| Sacramento (CA) | 2,456 | 487 | 147 | 76.8% | 15,845 |
| New York | 4,047 | 2,311 | 705 | 76.6% | 17,028 |
| Orlando (FL) | 2,494 | 901 | 305 | 74.7% | 13,934 |
| Seattle | 4,090 | 427 | 159 | 72.9% | 18,142 |
| Miami (FL) | 1,691 | 550 | 256 | 68.2% | 8,119 |
| Chicago | 4,425 | 557 | 272 | 67.2% | 22,685 |
| Oakland Park (FL) | 1,805 | 398 | 211 | 65.4% | 6,177 |
| Newark | 3,802 | 1,070 | 570 | 65.2% | 17,670 |
| Imperial (CA) | 250 | 69 | 42 | 62.2% | 2,036 |
| Queens | 3,280 | 821 | 689 | 54.4% | 11,908 |
- Green cards granted in FY2024 to people born in Russia, Ukraine and ten other former Soviet countries, by class of admission, are in the former-Soviet-Union report: for Russia, 4,920 of 10,720 were immediate relatives of U.S. citizens (DHS OHSS).
- Firm offices: Boca Raton (Oakland Park and West Palm Beach are the nearest USCIS field offices) and, by appointment, Westlake Village near Los Angeles. See Miami and Los Angeles.
How to read these numbers
- Approval share
- Approved ÷ (approved + denied) in the period, computed from USCIS counts. Decisions in a quarter concern petitions filed months or years earlier, so the share describes USCIS's adjudication, not the chances of a petition filed today.
- Immediate relative vs. preference category
- Immediate relatives (spouses, parents, unmarried children under 21 of U.S. citizens) have no annual visa cap. Preference categories (relatives of permanent residents, adult children and siblings of citizens) wait for a visa number, which is why 1.6 million petitions sit in that row awaiting a decision.
- Median processing time
- USCIS's median months from receipt to completion for cases completed in the quarter. Half of completed cases took longer. The August 2026 report to Congress uses an average instead.
- Field office counts
- Most I-130 petitions are decided at service centers; the field-office table only counts petitions adjudicated locally, usually with an interview, so one office's share can move a lot between quarters.
Sources and method
Every figure on this page comes from a file published by the U.S. government, retrieved October 31, 2026. The tables were extracted from the original PDF and Excel files by scripts that check each table against the totals printed in the same file (row sums, recomputed rates, fiscal-year sequences). Derived measures such as approval shares and year-over-year changes are computed from the published counts, and the formula is stated next to each one.
The federal fiscal year starts on October 1: FY2026 runs from October 1, 2025 to September 30, 2026. Partial years are marked. Agencies suppress small cells to protect privacy; those cells are shown as “—” and left out of sums, which explains small gaps against national totals.
- USCIS: All USCIS Application and Petition Form Types, FY2025 Q4
U.S. Citizenship and Immigration Services · agency page
- USCIS: All USCIS Application and Petition Form Types, FY2026 Q1
U.S. Citizenship and Immigration Services · agency page
- USCIS: All USCIS Application and Petition Form Types, FY2026 Q2
U.S. Citizenship and Immigration Services · agency page
- USCIS: All USCIS Application and Petition Form Types, FY2026 Q3
U.S. Citizenship and Immigration Services · agency page
- USCIS: FY22 Appropriations Reporting Requirement, Application Processing Data for August 2026
U.S. Citizenship and Immigration Services · data generated September 2026 · agency page
- USCIS: Form I-130 by Category, Case Status and Field Office, FY2026 Q3
U.S. Citizenship and Immigration Services · agency page
- USCIS: Form I-485 by Category, Case Status and Field Office, FY2026 Q3
U.S. Citizenship and Immigration Services · agency page
- USCIS: Form N-400 by Category, Case Status and Field Office, FY2026 Q3
U.S. Citizenship and Immigration Services · agency page
- Yearbook of Immigration Statistics 2024, Tables 3 and 10
U.S. Department of Homeland Security, Office of Homeland Security Statistics · data generated June 2026 · agency page
General information, not legal advice. Statistics describe groups of cases, not yours: an outcome depends on the facts, the evidence, the court and the governing law. Publication does not create an attorney-client relationship.
Marrying, sponsoring a spouse, or removing conditions?
Most denials the firm sees are files with a missing document, an unexplained inconsistency or a bona fide marriage that was never proven on paper. Tell us where your spouse or fiancé(e) is and how you entered; attorney Anna Tsibel handles I-130, I-485, I-751 and K-1 cases in English and Russian.
We take these cases: Asylum, Deportation and removal defense, Family and marriage-based immigration, K-1 fiancé(e) visa, I-751 removal of conditions and waivers, Inadmissibility waivers, VAWA self-petitions, Citizenship and naturalization.
(805) 409-9384