Russian Speakers in the U.S. 2026: Population by State, County and English Ability
How many people speak Russian at home in the United States, where they live, how many have limited English, and how the Russian-, Ukrainian- and Belarusian-born population has changed since 2010, from the Census Bureau's American Community Survey.
- Published
- Updated
- Compiled by
- Ace Immigration, the law firm of attorney Anna Tsibel
- License
- CC BY 4.0 — free to republish with credit
Data: ACS 2020–2024 5-year estimates (states, metros, counties) and ACS 1-year estimates 2010–2025 (national trend). Files retrieved October 31, 2026.
Key figures
1,020,261
people age 5 and over speak Russian at home in the United States (ACS 2020–2024)
U.S. Census Bureau41.4%
of them speak English less than “very well”: 422,601 people
U.S. Census Bureau47%
live in New York, California and Florida; New York alone has 227,300
U.S. Census Bureau90,022
Brooklyn residents were born in Russia, Ukraine or Belarus, more than any other U.S. county
U.S. Census Bureau
About a million Russian speakers, four in ten with limited English
About 1.02 million people age 5 and over speak Russian at home in the United States (1,020,261, ± 13,958), according to the Census Bureau's American Community Survey for 2020–2024 (U.S. Census Bureau, American Community Survey). 422,601 of them, or 41.4%, say they speak English less than “very well”. Another 440,589 speak Ukrainian or another Slavic language at home, and 252,536 speak Armenian.
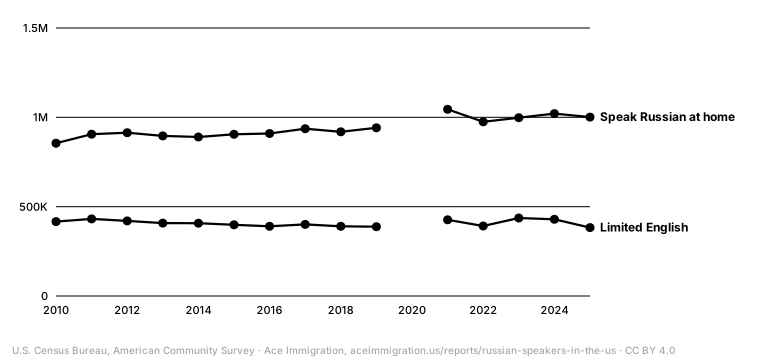
The yearly estimates show slow growth, from 854,955 in 2010 to about a million since 2021 (1,001,388 in 2025), while the number with limited English has stayed near 400,000.
Source: Table B16001: Language Spoken at Home by Ability to Speak English for the Population 5 Years and Over, ACS 1-year estimates 2010-2025ACS 1-year estimates, 90% margins of error. The Census Bureau released no standard 1-year estimates for 2020 (pandemic data collection), so that year is blank. Year-to-year changes smaller than about 40,000 are within the margins of error and should not be read as real change.
Show the data
| Year | Speak Russian at home | Margin of error (±) | Speak English less than “very well” | Share with limited English |
|---|---|---|---|---|
| 2010 | 854,955 | 24,491 | 416,391 | 48.7% |
| 2011 | 905,843 | 26,402 | 431,762 | 47.7% |
| 2012 | 914,217 | 24,947 | 420,163 | 46.0% |
| 2013 | 895,902 | 24,421 | 408,195 | 45.6% |
| 2014 | 890,120 | 21,099 | 407,354 | 45.8% |
| 2015 | 905,149 | 26,007 | 398,498 | 44.0% |
| 2016 | 909,374 | 20,097 | 390,292 | 42.9% |
| 2017 | 936,344 | 23,734 | 400,795 | 42.8% |
| 2018 | 919,279 | 22,627 | 389,867 | 42.4% |
| 2019 | 941,454 | 26,758 | 387,829 | 41.2% |
| 2021 | 1,044,892 | 24,798 | 426,731 | 40.8% |
| 2022 | 974,829 | 30,538 | 391,777 | 40.2% |
| 2023 | 998,179 | 31,793 | 436,396 | 43.7% |
| 2024 | 1,021,165 | 27,056 | 429,378 | 42.0% |
| 2025 | 1,001,388 | 31,171 | 382,764 | 38.2% |
New York, California and Florida: 47% of all Russian speakers
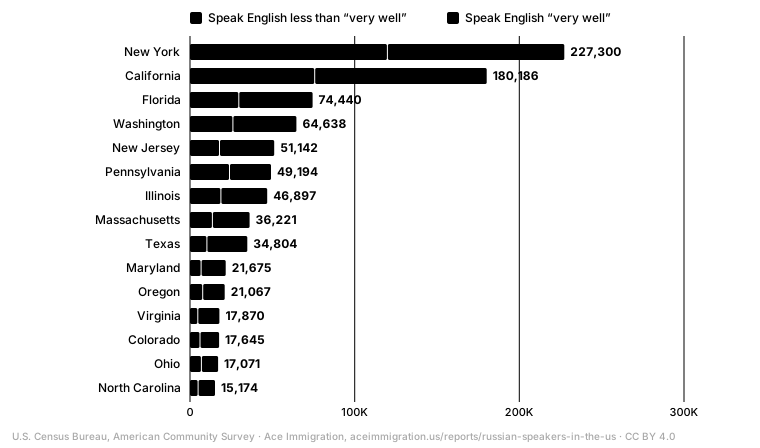
New York has 227,300 Russian speakers (± 6,344), 22.3% of the national total, followed by California (180,186) and Florida (74,440). Washington (64,638), New Jersey (51,142), Pennsylvania (49,194) and Illinois (46,897) come next; the last three are within the margin of error of one another. Relative to population, New York leads with 12.1 Russian speakers per 1,000 residents age 5 and over, ahead of Washington (8.8).
Source: Table B16001: Language Spoken at Home by Ability to Speak English for the Population 5 Years and Over, ACS 2020-2024 5-year estimatesAll 50 states and D.C. are in the table; they sum exactly to the U.S. total of 1,020,261. Margins of error are at the 90% confidence level.
Show the data
| State | Speak Russian at home | Margin of error (±) | Speak English less than “very well” | Share with limited English | Share of U.S. Russian speakers | Per 1,000 residents age 5+ |
|---|---|---|---|---|---|---|
| New York | 227,300 | 6,344 | 120,180 | 52.9% | 22.3% | 12.1 |
| California | 180,186 | 5,584 | 76,033 | 42.2% | 17.7% | 4.9 |
| Florida | 74,440 | 3,563 | 29,963 | 40.3% | 7.3% | 3.5 |
| Washington | 64,638 | 4,101 | 26,329 | 40.7% | 6.3% | 8.8 |
| New Jersey | 51,142 | 3,426 | 18,191 | 35.6% | 5.0% | 5.8 |
| Pennsylvania | 49,194 | 2,954 | 24,308 | 49.4% | 4.8% | 4.0 |
| Illinois | 46,897 | 2,757 | 19,090 | 40.7% | 4.6% | 3.9 |
| Massachusetts | 36,221 | 2,566 | 13,911 | 38.4% | 3.6% | 5.4 |
| Texas | 34,804 | 1,996 | 10,557 | 30.3% | 3.4% | 1.2 |
| Maryland | 21,675 | 1,828 | 7,021 | 32.4% | 2.1% | 3.7 |
| Oregon | 21,067 | 2,264 | 8,022 | 38.1% | 2.1% | 5.2 |
| Virginia | 17,870 | 1,391 | 5,029 | 28.1% | 1.8% | 2.2 |
| Colorado | 17,645 | 1,447 | 6,364 | 36.1% | 1.7% | 3.2 |
| Ohio | 17,071 | 1,543 | 7,203 | 42.2% | 1.7% | 1.5 |
| North Carolina | 15,174 | 1,481 | 5,201 | 34.3% | 1.5% | 1.5 |
| Georgia | 14,989 | 2,018 | 4,571 | 30.5% | 1.5% | 1.5 |
| Minnesota | 13,851 | 1,218 | 5,159 | 37.2% | 1.4% | 2.6 |
| Michigan | 11,288 | 946 | 4,492 | 39.8% | 1.1% | 1.2 |
| Connecticut | 11,161 | 1,279 | 3,376 | 30.2% | 1.1% | 3.2 |
| South Carolina | 10,549 | 1,799 | 4,293 | 40.7% | 1.0% | 2.1 |
| Arizona | 7,633 | 1,068 | 2,109 | 27.6% | 0.7% | 1.1 |
| Missouri | 7,233 | 1,107 | 2,660 | 36.8% | 0.7% | 1.2 |
| Wisconsin | 5,875 | 762 | 1,757 | 29.9% | 0.6% | 1.0 |
| Nevada | 5,574 | 779 | 1,839 | 33.0% | 0.5% | 1.9 |
| Utah | 5,090 | 716 | 1,268 | 24.9% | 0.5% | 1.6 |
| Indiana | 4,018 | 636 | 1,238 | 30.8% | 0.4% | 0.6 |
| Tennessee | 3,889 | 825 | 867 | 22.3% | 0.4% | 0.6 |
| Idaho | 3,780 | 944 | 733 | 19.4% | 0.4% | 2.1 |
| Alaska | 3,427 | 589 | 1,006 | 29.4% | 0.3% | 5.0 |
| Oklahoma | 3,021 | 510 | 728 | 24.1% | 0.3% | 0.8 |
| Kentucky | 2,855 | 589 | 771 | 27.0% | 0.3% | 0.7 |
| Rhode Island | 2,669 | 729 | 794 | 29.7% | 0.3% | 2.5 |
| Kansas | 2,491 | 525 | 1,117 | 44.8% | 0.2% | 0.9 |
| New Hampshire | 2,488 | 580 | 783 | 31.5% | 0.2% | 1.9 |
| Iowa | 2,381 | 592 | 574 | 24.1% | 0.2% | 0.8 |
| Alabama | 2,145 | 523 | 466 | 21.7% | 0.2% | 0.4 |
| District of Columbia | 2,112 | 409 | 223 | 10.6% | 0.2% | 3.3 |
| Nebraska | 2,082 | 517 | 565 | 27.1% | 0.2% | 1.1 |
| Louisiana | 1,867 | 529 | 587 | 31.4% | 0.2% | 0.4 |
| Hawaii | 1,708 | 424 | 582 | 34.1% | 0.2% | 1.3 |
| Montana | 1,537 | 455 | 346 | 22.5% | 0.2% | 1.5 |
| Delaware | 1,492 | 387 | 368 | 24.7% | 0.1% | 1.5 |
| South Dakota | 1,460 | 642 | 455 | 31.2% | 0.1% | 1.7 |
| Maine | 1,279 | 411 | 293 | 22.9% | 0.1% | 1.0 |
| New Mexico | 1,062 | 316 | 321 | 30.2% | 0.1% | 0.5 |
| Vermont | 949 | 288 | 231 | 24.3% | 0.1% | 1.5 |
| Arkansas | 705 | 345 | 187 | 26.5% | 0.1% | 0.2 |
| Mississippi | 631 | 261 | 125 | 19.8% | 0.1% | 0.2 |
| Wyoming | 623 | 328 | 64 | 10.3% | 0.1% | 1.1 |
| North Dakota | 574 | 201 | 161 | 28.0% | 0.1% | 0.8 |
| West Virginia | 449 | 171 | 90 | 20.0% | 0.0% | 0.3 |
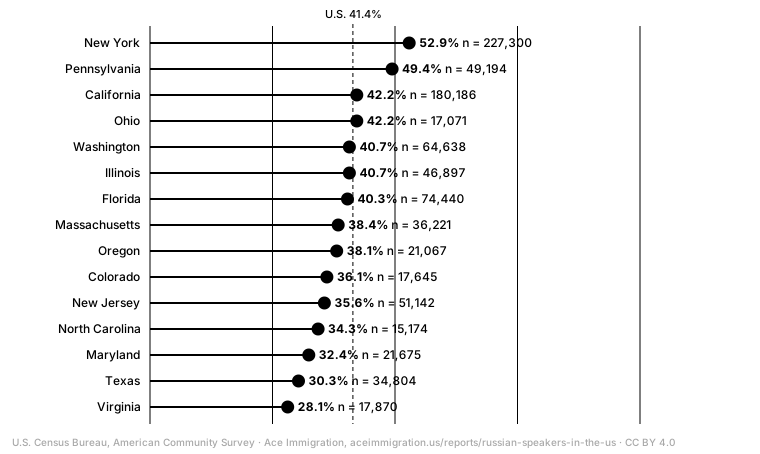
In New York 52.9% of Russian speakers speak English less than “very well”, the highest share of any state with at least 15,000 Russian speakers, against 41.4% nationally.
- The firm serves clients nationwide; regional pages cover New York, Los Angeles and Miami.
Brooklyn is the center: 90,022 residents born in Russia, Ukraine or Belarus
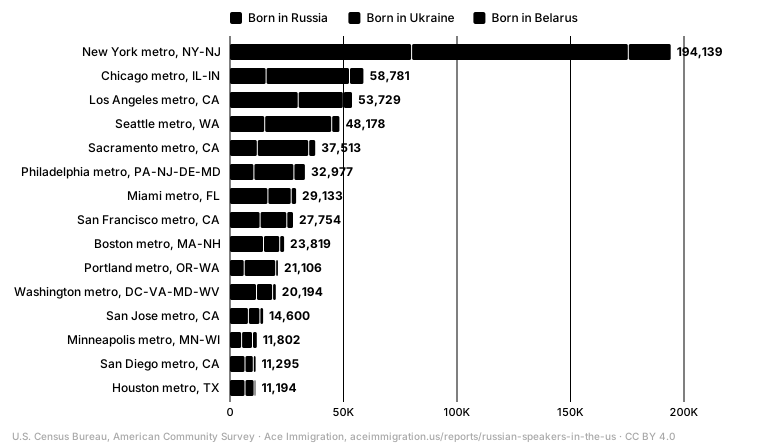
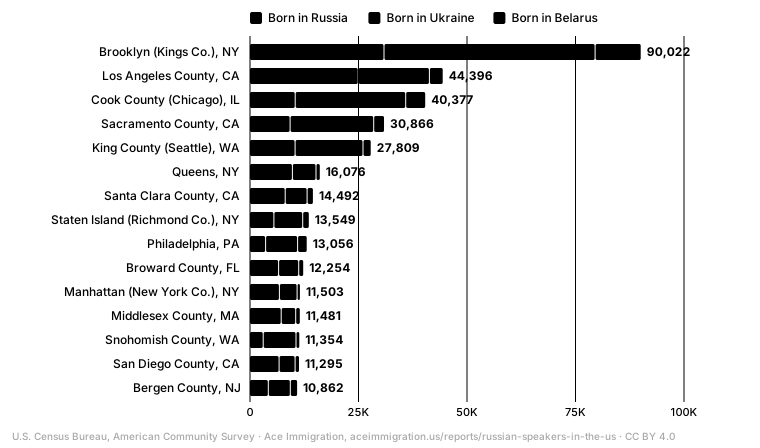
Below the state level the Census Bureau does not publish Russian as a separate language, so local figures use country of birth (U.S. Census Bureau, American Community Survey). On that measure the New York metro area has 194,139 residents born in Russia, Ukraine or Belarus, more than the next three metros combined. New York City's five boroughs have 134,720, and Brooklyn alone 90,022 (31,000 born in Russia, 48,637 in Ukraine, 10,385 in Belarus), about twice Los Angeles County (44,396).
Source: Table B05006: Place of Birth for the Foreign-Born Population in the United States, ACS 2020-2024 5-year estimatesThe detailed language table (Russian as a separate language) is not published below the state level, so local rankings use country of birth. That undercounts U.S.-born Russian speakers and counts Ukrainian- and Belarusian-born residents whatever language they speak.
Show the data
| Metro area | Born in Russia | ± Russia | Born in Ukraine | ± Ukraine | Born in Belarus | Total |
|---|---|---|---|---|---|---|
| New York-Newark-Jersey City, NY-NJ Metro Area | 80,202 | 3,398 | 95,463 | 3,769 | 18,474 | 194,139 |
| Chicago-Naperville-Elgin, IL-IN Metro Area | 16,144 | 1,571 | 36,702 | 3,077 | 5,935 | 58,781 |
| Los Angeles-Long Beach-Anaheim, CA Metro Area | 30,264 | 1,957 | 19,879 | 1,542 | 3,586 | 53,729 |
| Seattle-Tacoma-Bellevue, WA Metro Area | 15,513 | 1,655 | 29,530 | 3,049 | 3,135 | 48,178 |
| Sacramento-Roseville-Folsom, CA Metro Area | 12,239 | 1,686 | 22,639 | 1,971 | 2,635 | 37,513 |
| Philadelphia-Camden-Wilmington, PA-NJ-DE-MD Metro Area | 10,734 | 1,116 | 17,620 | 1,623 | 4,623 | 32,977 |
| Miami-Fort Lauderdale-West Palm Beach, FL Metro Area | 16,896 | 1,554 | 10,275 | 1,244 | 1,962 | 29,133 |
| San Francisco-Oakland-Fremont, CA Metro Area | 13,459 | 1,317 | 11,795 | 1,279 | 2,500 | 27,754 |
| Boston-Cambridge-Newton, MA-NH Metro Area | 14,972 | 1,548 | 7,131 | 727 | 1,716 | 23,819 |
| Portland-Vancouver-Hillsboro, OR-WA Metro Area | 6,463 | 1,018 | 13,905 | 1,416 | 738 | 21,106 |
| Washington-Arlington-Alexandria, DC-VA-MD-WV Metro Area | 11,910 | 1,252 | 7,088 | 901 | 1,196 | 20,194 |
| San Jose-Sunnyvale-Santa Clara, CA Metro Area | 8,336 | 987 | 5,055 | 789 | 1,209 | 14,600 |
| Minneapolis-St. Paul-Bloomington, MN-WI Metro Area | 5,330 | 623 | 4,782 | 693 | 1,690 | 11,802 |
| San Diego-Chula Vista-Carlsbad, CA Metro Area | 6,809 | 1,104 | 3,693 | 567 | 793 | 11,295 |
| Houston-Pasadena-The Woodlands, TX Metro Area | 6,828 | 1,060 | 4,015 | 827 | 351 | 11,194 |
| Denver-Aurora-Centennial, CO Metro Area | 5,470 | 656 | 3,780 | 835 | 1,519 | 10,769 |
| Cleveland, OH Metro Area | 2,534 | 446 | 7,471 | 1,179 | 440 | 10,445 |
| Atlanta-Sandy Springs-Roswell, GA Metro Area | 5,101 | 693 | 4,318 | 837 | 774 | 10,193 |
| Detroit-Warren-Dearborn, MI Metro Area | 3,713 | 565 | 5,923 | 847 | 448 | 10,084 |
| Dallas-Fort Worth-Arlington, TX Metro Area | 5,195 | 688 | 3,892 | 814 | 719 | 9,806 |
Source: Table B05006: Place of Birth for the Foreign-Born Population in the United States, ACS 2020-2024 5-year estimatesThe table lists the 30 largest counties plus every New York City borough, the New York and New Jersey suburbs, Miami-Dade, Broward, Palm Beach, Los Angeles and Ventura counties.
Show the data
| County | Born in Russia | ± Russia | Born in Ukraine | ± Ukraine | Born in Belarus | Total |
|---|---|---|---|---|---|---|
| Brooklyn (Kings Co.), NY | 31,000 | 1,932 | 48,637 | 2,695 | 10,385 | 90,022 |
| Los Angeles County, CA | 25,039 | 1,742 | 16,423 | 1,432 | 2,934 | 44,396 |
| Cook County (Chicago), IL | 10,536 | 1,290 | 25,462 | 2,363 | 4,379 | 40,377 |
| Sacramento County, CA | 9,348 | 1,604 | 19,270 | 1,770 | 2,248 | 30,866 |
| King County (Seattle), WA | 10,498 | 1,185 | 15,664 | 1,985 | 1,647 | 27,809 |
| Queens, NY | 9,886 | 1,415 | 5,444 | 792 | 746 | 16,076 |
| Santa Clara County, CA | 8,237 | 995 | 5,046 | 787 | 1,209 | 14,492 |
| Staten Island (Richmond Co.), NY | 5,620 | 1,121 | 6,639 | 1,014 | 1,290 | 13,549 |
| Philadelphia, PA | 3,702 | 692 | 7,371 | 1,151 | 1,983 | 13,056 |
| Broward County, FL | 6,716 | 1,062 | 4,621 | 832 | 917 | 12,254 |
| Manhattan (New York Co.), NY | 6,889 | 980 | 4,088 | 744 | 526 | 11,503 |
| Middlesex County, MA | 7,295 | 1,036 | 3,345 | 561 | 841 | 11,481 |
| Snohomish County, WA | 3,159 | 806 | 7,545 | 1,405 | 650 | 11,354 |
| San Diego County, CA | 6,809 | 1,104 | 3,693 | 567 | 793 | 11,295 |
| Bergen County, NJ | 4,325 | 601 | 5,071 | 944 | 1,466 | 10,862 |
| Miami-Dade County, FL | 5,924 | 867 | 3,372 | 614 | 614 | 9,910 |
| Bucks County, PA | 2,365 | 481 | 5,603 | 990 | 1,708 | 9,676 |
| Orange County, CA | 5,225 | 768 | 3,456 | 744 | 652 | 9,333 |
| Clark County, WA | 3,268 | 786 | 5,745 | 1,026 | 150 | 9,163 |
| Pierce County, WA | 1,856 | 408 | 6,321 | 1,414 | 838 | 9,015 |
| San Francisco, CA | 4,402 | 990 | 3,742 | 545 | 655 | 8,799 |
| Cuyahoga County (Cleveland), OH | 1,709 | 365 | 6,374 | 1,048 | 355 | 8,438 |
| Lake County, IL | 2,772 | 593 | 3,791 | 607 | 1,210 | 7,773 |
| Montgomery County, MD | 4,350 | 762 | 2,533 | 583 | 438 | 7,321 |
| Palm Beach County, FL | 4,256 | 763 | 2,282 | 503 | 431 | 6,969 |
| San Mateo County, CA | 3,138 | 550 | 2,836 | 938 | 907 | 6,881 |
| Multnomah County (Portland), OR | 1,691 | 381 | 4,512 | 832 | 337 | 6,540 |
| Harris County (Houston), TX | 3,965 | 699 | 2,327 | 608 | 240 | 6,532 |
| Spartanburg County, SC | 1,417 | 868 | 4,415 | 979 | 371 | 6,203 |
| Contra Costa County, CA | 2,826 | 493 | 2,867 | 611 | 452 | 6,145 |
| Middlesex County, NJ | 2,253 | 517 | 3,354 | 601 | 235 | 5,842 |
| Nassau County, NY | 2,524 | 452 | 2,630 | 566 | 660 | 5,814 |
| Westchester County, NY | 2,087 | 485 | 1,952 | 511 | 549 | 4,588 |
| Suffolk County, NY | 2,042 | 413 | 2,283 | 646 | 241 | 4,566 |
| Bronx, NY | 2,110 | 453 | 1,399 | 469 | 61 | 3,570 |
| Ventura County, CA | 843 | 306 | 756 | 688 | 135 | 1,734 |
Ukrainian-born residents now outnumber Russian-born residents
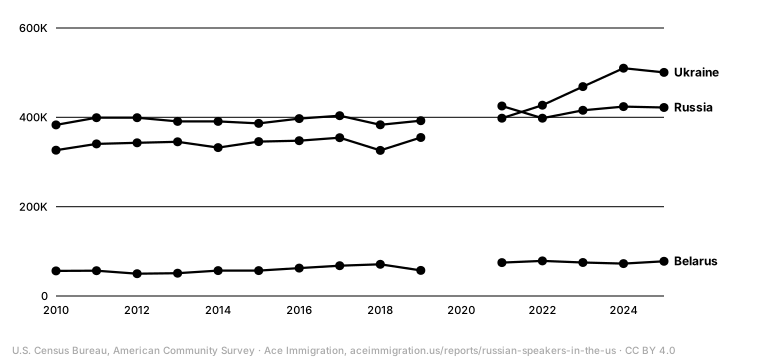
From 2010 to 2019 the U.S. counted roughly 380,000 to 400,000 residents born in Russia and 325,000 to 355,000 born in Ukraine. The Ukrainian-born population then passed the Russian-born one: 427,163 against 398,123 in 2022, a gap only just beyond the margin of error, clear by 2023 and at 500,614 against 421,951 in 2025 (U.S. Census Bureau, American Community Survey). The 5-year estimate pools 2020–2024, so it trails recent arrivals: it shows 443,259 born in Ukraine, 419,434 in Russia and 74,707 in Belarus.
Source: Table B05006: Place of Birth for the Foreign-Born Population in the United States, ACS 1-year estimates 2010-2025Foreign-born residents only, by country of birth; ACS 1-year estimates (no 2020 release). Ukrainians who arrived under Uniting for Ukraine parole or hold TPS are counted if they live in a sampled household, whatever their status.
Show the data
| Year | Russia | Ukraine | Belarus | Uzbekistan | Kazakhstan | Moldova |
|---|---|---|---|---|---|---|
| 2010 | 383,166 | 326,493 | 56,217 | 44,636 | 22,401 | 33,659 |
| 2011 | 399,216 | 340,468 | 56,618 | 51,421 | 23,910 | 34,152 |
| 2012 | 399,128 | 342,971 | 49,823 | 60,438 | 24,162 | 41,340 |
| 2013 | 390,934 | 345,187 | 50,934 | 48,197 | 26,334 | 34,913 |
| 2014 | 390,977 | 332,145 | 56,791 | 49,181 | 26,527 | 41,193 |
| 2015 | 386,529 | 345,620 | 56,958 | 65,375 | 29,859 | 43,564 |
| 2016 | 397,236 | 347,759 | 62,514 | 62,713 | 32,017 | 42,403 |
| 2017 | 403,670 | 354,494 | 67,762 | 58,337 | 30,035 | 47,156 |
| 2018 | 383,305 | 325,885 | 70,969 | 68,512 | 28,290 | 47,767 |
| 2019 | 392,422 | 354,832 | 57,315 | 65,126 | 33,438 | 46,388 |
| 2021 | 425,429 | 398,040 | 74,830 | 68,637 | 35,917 | 60,097 |
| 2022 | 398,123 | 427,163 | 78,694 | 71,226 | 46,325 | 55,977 |
| 2023 | 415,809 | 468,780 | 75,035 | 74,967 | 50,833 | 47,498 |
| 2024 | 424,059 | 510,016 | 72,513 | 81,552 | 47,270 | 55,810 |
| 2025 | 421,951 | 500,614 | 77,693 | 76,919 | 41,535 | 44,519 |
How to read these numbers
- Russian speaker
- A person age 5 or older who speaks Russian at home, as reported in the American Community Survey. It counts language use, not ethnicity, citizenship or country of birth: it includes U.S.-born children and people born in Ukraine, Belarus, Kazakhstan, Israel or elsewhere who speak Russian at home, and leaves out people who know Russian but speak English at home.
- Limited English
- Speaking English less than “very well” (“well”, “not well” or “not at all”), the Census Bureau's standard measure of limited English proficiency. It is self-reported by the household.
- 5-year and 1-year estimates
- State, metro and county figures are ACS 5-year estimates (survey responses pooled over 2020–2024), the most reliable for smaller areas. The national trend uses 1-year estimates, which are more current but noisier; the two series are not meant to be compared directly.
- Margin of error
- The ACS is a sample survey. Every estimate has a 90% margin of error. The language tables show it, the metro and county tables show it for Russia and Ukraine, and Census Table B05006 has the rest. New York's Russian-speaker count, for example, is ± 6,344. Close ranks, such as New Jersey, Pennsylvania and Illinois, are within the margin of error of each other.
Sources and method
Every figure on this page comes from a file published by the U.S. government, retrieved October 31, 2026. The tables were extracted from the original PDF and Excel files by scripts that check each table against the totals printed in the same file (row sums, recomputed rates, fiscal-year sequences). Derived measures such as approval shares and year-over-year changes are computed from the published counts, and the formula is stated next to each one.
The federal fiscal year starts on October 1: FY2026 runs from October 1, 2025 to September 30, 2026. Partial years are marked. Agencies suppress small cells to protect privacy; those cells are shown as “—” and left out of sums, which explains small gaps against national totals.
- Table B16001: Language Spoken at Home by Ability to Speak English for the Population 5 Years and Over, ACS 2020-2024 5-year estimates
U.S. Census Bureau, American Community Survey · agency page
- Table B16001: Language Spoken at Home by Ability to Speak English for the Population 5 Years and Over, ACS 1-year estimates 2010-2025
U.S. Census Bureau, American Community Survey · agency page
- Table B05006: Place of Birth for the Foreign-Born Population in the United States, ACS 2020-2024 5-year estimates
U.S. Census Bureau, American Community Survey · agency page
- Table B05006: Place of Birth for the Foreign-Born Population in the United States, ACS 1-year estimates 2010-2025
U.S. Census Bureau, American Community Survey · agency page
General information, not legal advice. Statistics describe groups of cases, not yours: an outcome depends on the facts, the evidence, the court and the governing law. Publication does not create an attorney-client relationship.
Immigration counsel in Russian, wherever you live
Four in ten Russian speakers in the U.S. say they speak English less than very well, and immigration forms, interviews and hearings run in English. Attorney Anna Tsibel takes asylum, deportation defense, marriage green card and waiver cases in Russian and English in all 50 states. Tell us your situation and where you live.
We take these cases: Asylum, Deportation and removal defense, Family and marriage-based immigration, K-1 fiancé(e) visa, I-751 removal of conditions and waivers, Inadmissibility waivers, VAWA self-petitions, Citizenship and naturalization.
(805) 409-9384