Asylum Outcomes for Russians, Ukrainians, Belarusians and Central Asians: U.S. Data 2015–2024
A bilingual compilation of U.S. government asylum data for nationals of Russia, Ukraine, Belarus, Kazakhstan, Uzbekistan, Kyrgyzstan, Tajikistan, Turkmenistan, Georgia, Armenia, Azerbaijan and Moldova.
- Published
- Updated
- Compiled by
- Ace Immigration, the law firm of attorney Anna Tsibel
- License
- CC BY 4.0 — free to republish with credit
Data: EOIR nationality tables for FY2023 (rates) and FY2024 (counts); DHS Yearbook 2024 (grants by nationality through FY2024); USCIS asylum workload through FY2024. Files retrieved October 31, 2026.
Key figures
85.5%
of Russian asylum decisions on the merits in FY2024 were grants (3,605 granted, 613 denied) against 45.7% for all nationalities
U.S. Department of Justice, October 10, 20243,970
Russian nationals granted asylum in FY2024, ten times the 2015 figure; 91% of them by an immigration judge
U.S. Department of Homeland Security, August 202675%
grant rate for Belarusians in FY2023 as EOIR counts it (grants ÷ all decisions), the highest of the twelve countries
U.S. Department of Justice, October 12, 20239,160
affirmative asylum cases filed by Russians with USCIS in FY2023, the most in the FY2014–FY2024 series; 3,590 followed in FY2024
U.S. Department of Homeland Security, August 2026
Immigration court, FY2024: Russians won 85% of decided cases
In FY2024 immigration judges granted asylum to 3,605 Russian nationals and denied 613, so 85.5% of decisions on the merits were grants. The national share that year was 45.7% (32,436 granted, 38,529 denied). Belarus (87.8%), Kazakhstan (83.2%), Ukraine (82.5%) and Georgia (66.0%) were also well above the national figure; Uzbekistan (49.5%) and Tajikistan (45.3%) were closest to it (U.S. Department of Justice, Executive Office for Immigration Review).
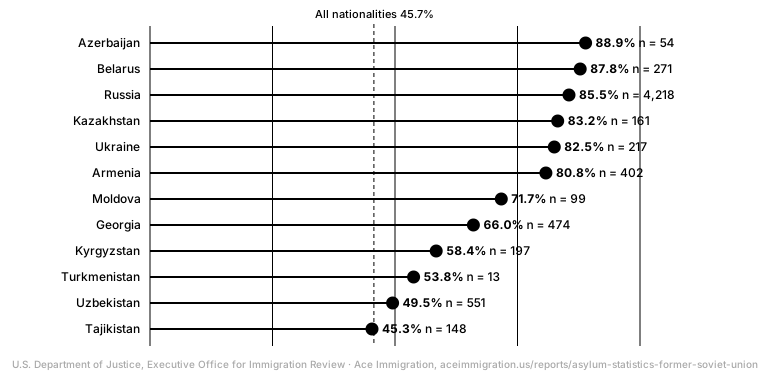
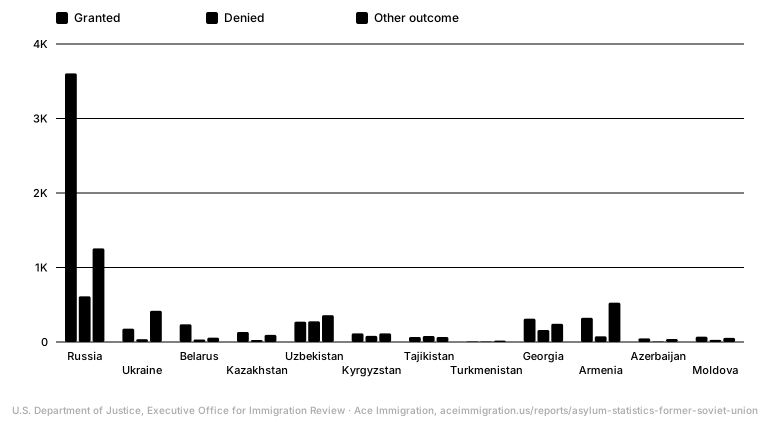
Volume matters as much as the rate. Russia accounted for 5,474 court asylum decisions in FY2024, more than the other eleven countries combined (4,588). Of Russia's decisions, 807 were never adjudicated and 336 were abandoned, which is why the grant share of all decisions, 65.9%, is lower than the share of merits decisions.
Source: EOIR Adjudication Statistics: Asylum Decisions by Nationality (FY2024), data generated October 10, 2024
Show the data
| Nationality | Granted | Denied | Abandoned | Not adjudicated | Withdrawn |
|---|---|---|---|---|---|
| Russia | 3,605 | 613 | 336 | 807 | 113 |
| Ukraine | 179 | 38 | 18 | 382 | 19 |
| Belarus | 238 | 33 | 12 | 41 | 5 |
| Kazakhstan | 134 | 27 | 29 | 56 | 10 |
| Uzbekistan | 273 | 278 | 150 | 119 | 91 |
| Kyrgyzstan | 115 | 82 | 43 | 67 | 6 |
| Tajikistan | 67 | 81 | 19 | 32 | 16 |
| Turkmenistan | 7 | 6 | 6 | 13 | — |
| Georgia | 313 | 161 | 90 | 123 | 31 |
| Armenia | 325 | 77 | 37 | 472 | 19 |
| Azerbaijan | 48 | 6 | 7 | 33 | — |
| Moldova | 71 | 28 | 6 | 49 | — |
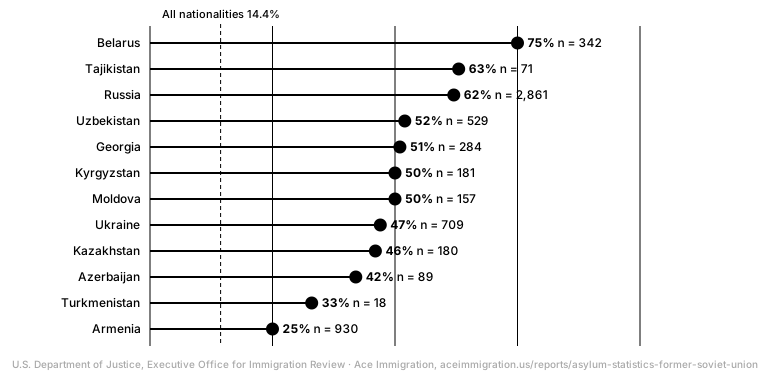
FY2023 as EOIR counts it: 25% to 75% depending on the country
EOIR last published grant rates by nationality for FY2023, dividing grants by all decisions. On that measure Belarus led at 75% of 342 decisions, Russia stood at 62% of 2,861, Ukraine at 47% of 709, and Armenia at 25% of 930, where 68% of decisions were abandoned, withdrawn or not reached. The figure for all nationalities was 14% (U.S. Department of Justice, Executive Office for Immigration Review).
Source: EOIR Adjudication Statistics: Asylum Decision Rates by Nationality (FY2023), data generated October 12, 2023EOIR's own rates: grants ÷ all decisions, where 'other' is abandoned, not adjudicated and withdrawn applications. FY2023 is the last year EOIR published rates.
Show the data
| Nationality | Granted | Grant rate | Denied | Denial rate | Other | Total decisions |
|---|---|---|---|---|---|---|
| Russia | 1,785 | 62% | 252 | 9% | 824 | 2,861 |
| Ukraine | 336 | 47% | 23 | 3% | 350 | 709 |
| Belarus | 255 | 75% | 25 | 7% | 62 | 342 |
| Kazakhstan | 82 | 46% | 23 | 13% | 75 | 180 |
| Uzbekistan | 277 | 52% | 88 | 17% | 164 | 529 |
| Kyrgyzstan | 90 | 50% | 21 | 12% | 70 | 181 |
| Tajikistan | 45 | 63% | 5 | 7% | 21 | 71 |
| Turkmenistan | 6 | 33% | 7 | 39% | 5 | 18 |
| Georgia | 145 | 51% | 22 | 8% | 117 | 284 |
| Armenia | 232 | 25% | 64 | 7% | 634 | 930 |
| Azerbaijan | 37 | 42% | 16 | 18% | 36 | 89 |
| Moldova | 79 | 50% | 22 | 14% | 56 | 157 |
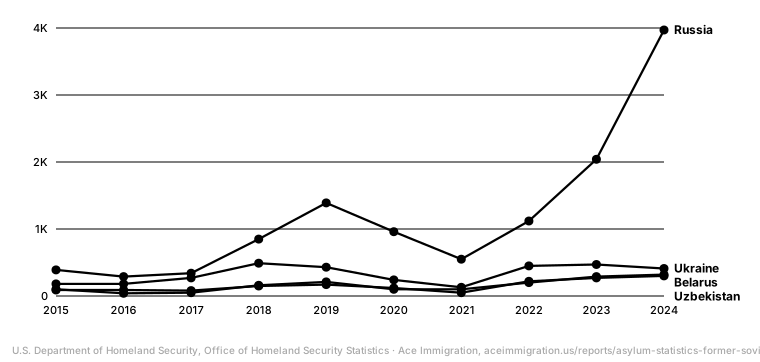
Ten years of grants: Russia ×10, Belarus ×3, Uzbekistan ×3
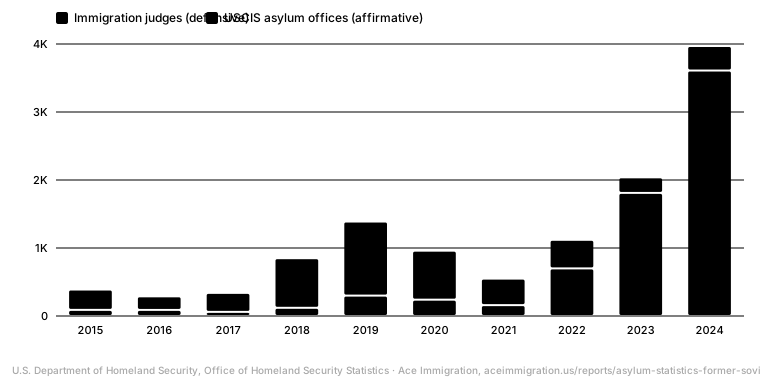
The DHS Yearbook counts people granted asylum. Russian nationals went from 390 in FY2015 to 3,970 in FY2024; Belarusians from 100 to 320; Uzbeks from 90 to 300; Ukrainians from 180 to 410, with a peak of 490 in FY2018 (U.S. Department of Homeland Security, Office of Homeland Security Statistics). Ukrainian numbers stay low partly because most Ukrainians who arrived after February 2022 came under Uniting for Ukraine parole or hold TPS rather than asylum (see Ukraine TPS after October 19, 2026).
Source: Yearbook of Immigration Statistics 2024, Tables 17 (affirmative) and 19 (defensive), data generated August 2026Persons granted asylum by USCIS asylum offices plus persons granted by immigration judges; OHSS rounds each figure to the nearest 10.
Show the data
| Nationality | 2015 | 2016 | 2017 | 2018 | 2019 | 2020 | 2021 | 2022 | 2023 | 2024 |
|---|---|---|---|---|---|---|---|---|---|---|
| Russia | 390 | 290 | 340 | 850 | 1,390 | 960 | 550 | 1,120 | 2,040 | 3,970 |
| Ukraine | 180 | 180 | 270 | 490 | 430 | 240 | 130 | 450 | 470 | 410 |
| Belarus | 100 | 40 | 50 | 160 | 210 | 100 | 100 | 200 | 290 | 320 |
| Kazakhstan | 90 | 50 | 80 | 140 | 260 | 170 | 70 | 180 | 120 | 200 |
| Uzbekistan | 90 | 90 | 80 | 150 | 170 | 120 | 50 | 220 | 270 | 300 |
| Kyrgyzstan | 150 | 120 | 120 | 150 | 160 | 120 | 90 | 170 | 110 | 150 |
| Tajikistan | 30 | 30 | 20 | 40 | 20 | 20 | 10 | 50 | 50 | 90 |
| Turkmenistan | 10 | 10 | 10 | 40 | 60 | 50 | 20 | 20 | 40 | 50 |
| Georgia | 30 | 40 | 40 | 60 | 80 | 60 | 40 | 100 | 160 | 330 |
| Armenia | 70 | 30 | 70 | 170 | 240 | 120 | 60 | 300 | 270 | 350 |
| Azerbaijan | 30 | 10 | 30 | 90 | 110 | 80 | 40 | 90 | 70 | 130 |
| Moldova | 110 | 100 | 80 | 140 | 150 | 70 | 50 | 80 | 110 | 110 |
For Russians the growth came almost entirely from immigration judges: 3,610 of the 3,970 FY2024 grants (91%) were defensive, against 360 by USCIS asylum offices. In FY2019 the split was the reverse: 1,090 affirmative and 300 defensive.
Source: Yearbook of Immigration Statistics 2024, Tables 17 (affirmative) and 19 (defensive), data generated August 2026
Show the data
| Fiscal year | Affirmative | Defensive | Total |
|---|---|---|---|
| 2015 | 300 | 90 | 390 |
| 2016 | 200 | 90 | 290 |
| 2017 | 280 | 60 | 340 |
| 2018 | 730 | 120 | 850 |
| 2019 | 1,090 | 300 | 1,390 |
| 2020 | 720 | 240 | 960 |
| 2021 | 390 | 160 | 550 |
| 2022 | 420 | 700 | 1,120 |
| 2023 | 230 | 1,810 | 2,040 |
| 2024 | 360 | 3,610 | 3,970 |
USCIS asylum offices: 9,160 Russian filings in FY2023, most still waiting
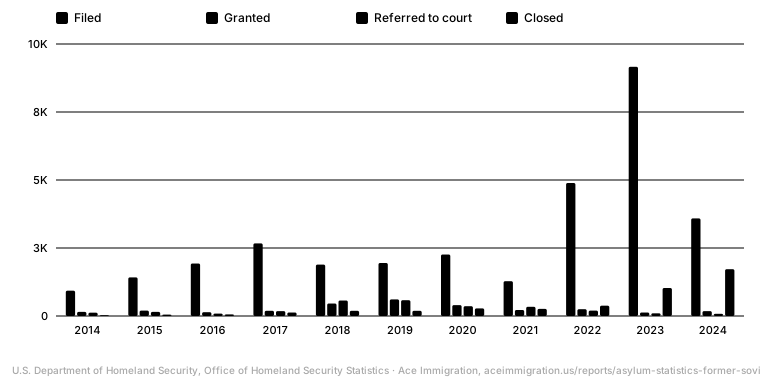
Russian nationals filed 4,890 affirmative asylum cases with USCIS in FY2022, 9,160 in FY2023 and 3,590 in FY2024, against 1,950 in FY2019. As of January 31, 2025, 7,340 of the FY2023 cases and 3,120 of the FY2024 cases were still pending; in FY2024, regardless of filing year, USCIS granted 180 Russian cases, referred 80 to court and closed 1,720 (U.S. Department of Homeland Security, Office of Homeland Security Statistics). Nationwide, USCIS had 372,950 FY2024 filings pending on the same date.
Source: OHSS: Asylum Workload by Top Nationalities, FY2014 to FY2024, data generated August 2026Cases filed and pending are by filing year; granted, denied, referred and closed are by decision year (OHSS). Pending is as of January 31, 2025; OHSS rounds to the nearest 10. Ukraine, Belarus and Central Asia are not broken out in this file.
Show the data
| Fiscal year | Filed | Granted | Denied | Referred to court | Closed | Pending on Jan 31, 2025 |
|---|---|---|---|---|---|---|
| 2014 | 930 | 150 | 10 | 120 | 30 | 80 |
| 2015 | 1,420 | 200 | 0 | 150 | 50 | 390 |
| 2016 | 1,930 | 140 | 0 | 90 | 60 | 1,170 |
| 2017 | 2,670 | 190 | 0 | 180 | 130 | 1,810 |
| 2018 | 1,890 | 460 | 10 | 570 | 190 | 610 |
| 2019 | 1,950 | 610 | 10 | 580 | 190 | 660 |
| 2020 | 2,260 | 400 | 0 | 360 | 280 | 1,580 |
| 2021 | 1,280 | 220 | 0 | 340 | 260 | 820 |
| 2022 | 4,890 | 250 | 0 | 200 | 380 | 3,560 |
| 2023 | 9,160 | 130 | 0 | 100 | 1,030 | 7,340 |
| 2024 | 3,590 | 180 | 0 | 80 | 1,720 | 3,120 |
- Nationwide affirmative asylum decisions collapsed in 2026: USCIS approved 66 applications in January to March 2026. See U.S. Asylum Statistics 2026.
- Ukrainians, Belarusians and Central Asians are grouped under “all other nationalities” in the USCIS workload file, so their affirmative filings cannot be separated here.
Beyond asylum: green cards and citizenship for the same countries
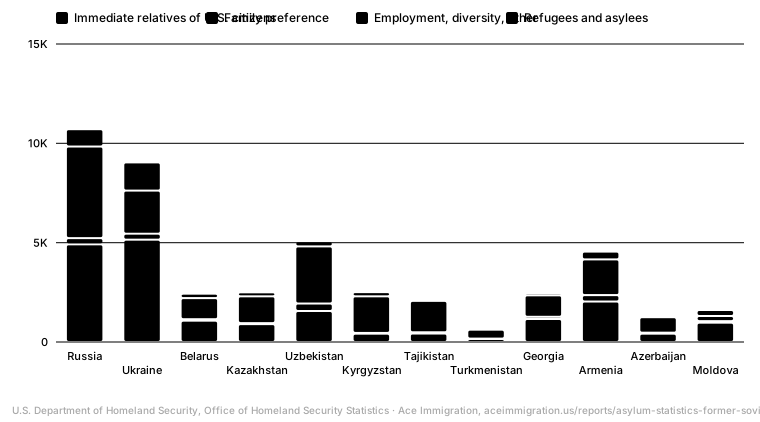
Asylum is one path of several. In FY2024, 10,720 people born in Russia and 9,030 born in Ukraine became lawful permanent residents. For Russia, 4,920 (46%) were immediate relatives of U.S. citizens, mostly spouses, and 870 were refugees or asylees adjusting status. Uzbekistan (2,670) and Kyrgyzstan (1,740) relied most on the diversity visa (U.S. Department of Homeland Security, Office of Homeland Security Statistics). 7,020 Russian-born and 9,130 Ukrainian-born residents naturalized the same year (U.S. Department of Homeland Security, Office of Homeland Security Statistics).
Source: Yearbook of Immigration Statistics 2024, Tables 3 and 10, data generated June 2026DHS Yearbook 2024, Tables 10 and 22; country of birth, not nationality; OHSS rounds to the nearest 10.
Show the data
| Country of birth | Total | Immediate relatives | Family preference | Employment | Diversity | Refugees and asylees | Naturalized in FY2024 |
|---|---|---|---|---|---|---|---|
| Russia | 10,720 | 4,920 | 310 | 2,150 | 2,440 | 870 | 7,020 |
| Ukraine | 9,030 | 5,150 | 300 | 1,010 | 1,150 | 1,420 | 9,130 |
| Belarus | 2,420 | 1,070 | 80 | 290 | 770 | 220 | 1,890 |
| Kazakhstan | 2,490 | 900 | 50 | 490 | 850 | 200 | 1,030 |
| Uzbekistan | 5,070 | 1,560 | 380 | 170 | 2,670 | 260 | 3,410 |
| Kyrgyzstan | 2,510 | 420 | 40 | 90 | 1,740 | 210 | 630 |
| Tajikistan | 2,140 | 430 | 60 | 90 | 1,480 | 70 | 550 |
| Turkmenistan | 670 | 150 | 20 | 40 | 410 | 50 | 150 |
| Georgia | 2,470 | 1,160 | 110 | 160 | 910 | 110 | 1,230 |
| Armenia | 4,540 | 2,040 | 320 | 320 | 1,470 | 390 | 2,610 |
| Azerbaijan | 1,340 | 420 | 50 | 130 | 640 | 100 | 850 |
| Moldova | 1,610 | 970 | 80 | 70 | 180 | 300 | 1,690 |
How to read these numbers
- Two different grant rates
- The FY2024 chart divides grants by grants plus denials, the share of decisions on the merits that succeeded. EOIR's FY2023 table divides grants by all decisions, including applications abandoned, withdrawn or never reached; that denominator is larger, so the rate is lower. Both are shown with their formula.
- Nationality vs. country of birth
- EOIR tables use nationality as recorded in the court case; the DHS Yearbook asylum tables use country of nationality, while its green card and naturalization tables use country of birth. A Russian-born citizen of Israel appears in different rows in different tables.
- Soviet-era names in EOIR files
- EOIR still prints Byelorussia, Kirghizia, Moldavia and Tadzhik next to the modern names. This page merges each pair; the tiny 'Byelorussia' legacy rows (4 cases in FY2023) are left out.
- Suppressed cells and rounding
- EOIR replaces small counts with an asterisk; those cells are shown as '—' and excluded from sums, which is why the twelve-country tables do not always add to the totals EOIR prints. OHSS rounds every figure to the nearest 10.
Sources and method
Every figure on this page comes from a file published by the U.S. government, retrieved October 31, 2026. The tables were extracted from the original PDF and Excel files by scripts that check each table against the totals printed in the same file (row sums, recomputed rates, fiscal-year sequences). Derived measures such as approval shares and year-over-year changes are computed from the published counts, and the formula is stated next to each one.
The federal fiscal year starts on October 1: FY2026 runs from October 1, 2025 to September 30, 2026. Partial years are marked. Agencies suppress small cells to protect privacy; those cells are shown as “—” and left out of sums, which explains small gaps against national totals.
- EOIR Adjudication Statistics: Asylum Decisions by Nationality (FY2024)
U.S. Department of Justice, Executive Office for Immigration Review · data generated October 10, 2024 · agency page
- EOIR Adjudication Statistics: Asylum Decision Rates by Nationality (FY2023)
U.S. Department of Justice, Executive Office for Immigration Review · data generated October 12, 2023 · agency page
- EOIR Adjudication Statistics: Asylum Decisions
U.S. Department of Justice, Executive Office for Immigration Review · data generated July 24, 2026 · agency page
- Yearbook of Immigration Statistics 2024, Tables 17 (affirmative) and 19 (defensive)
U.S. Department of Homeland Security, Office of Homeland Security Statistics · data generated August 2026 · agency page
- OHSS: Asylum Workload by Top Nationalities, FY2014 to FY2024
U.S. Department of Homeland Security, Office of Homeland Security Statistics · data generated August 2026 · agency page
- Yearbook of Immigration Statistics 2024, Tables 3 and 10
U.S. Department of Homeland Security, Office of Homeland Security Statistics · data generated June 2026 · agency page
- Yearbook of Immigration Statistics 2024, Table 22
U.S. Department of Homeland Security, Office of Homeland Security Statistics · data generated June 2026 · agency page
General information, not legal advice. Statistics describe groups of cases, not yours: an outcome depends on the facts, the evidence, the court and the governing law. Publication does not create an attorney-client relationship.
A Russian-speaking asylum lawyer who reads the same data
High grant shares for Russians and Belarusians are averages, not a promise: they show what documented, timely and well-argued cases achieve. Tell us your country, when you arrived and whether you have a hearing; attorney Anna Tsibel takes asylum cases from all 50 states in Russian and English.
We take these cases: Asylum, Deportation and removal defense, Family and marriage-based immigration, K-1 fiancé(e) visa, I-751 removal of conditions and waivers, Inadmissibility waivers, VAWA self-petitions, Citizenship and naturalization.
(805) 409-9384