U.S. Immigration Court Statistics 2026: Backlog, Wait Times and Outcomes
What the Executive Office for Immigration Review's own statistics say about the size of the docket, how cases end, and how many people face a judge without a lawyer.
- Published
- Updated
- Compiled by
- Ace Immigration, the law firm of attorney Anna Tsibel
- License
- CC BY 4.0 — free to republish with credit
Data: EOIR data generated July 24 and October 22, 2026; docket figures through September 30, 2026, outcomes through June 30, 2026. Files retrieved October 31, 2026.
Key figures
3.3M
cases pending in immigration court on September 30, 2026, down 15.9% from the FY2024 peak
U.S. Department of Justice, October 22, 2026281,867
in absentia removal orders in the first nine months of FY2026, about 31,000 a month
U.S. Department of Justice, July 24, 202655%
of cases completed in FY2025 (excluding in absentia orders, terminations and dismissals) had a lawyer or accredited representative; 77% of asylum cases did
U.S. Department of Justice, November 18, 202574%
of 641,503 initial decisions from October 2025 to June 2026 were removal orders; 2.2% granted relief
U.S. Department of Justice, July 24, 2026
The backlog: 3.3 million cases, and shrinking for the second year running
On September 30, 2026, 3,300,793 cases were pending before the immigration courts, according to the Executive Office for Immigration Review. That is 624,124 fewer than the record 3,924,917 at the end of FY2024, and the second consecutive annual decline. Before FY2025 the backlog had grown every year since EOIR's published series began in FY2017, when 975,999 cases were pending.
Source: EOIR Adjudication Statistics: Pending Cases, New Cases, and Total Completions, data generated October 22, 2026
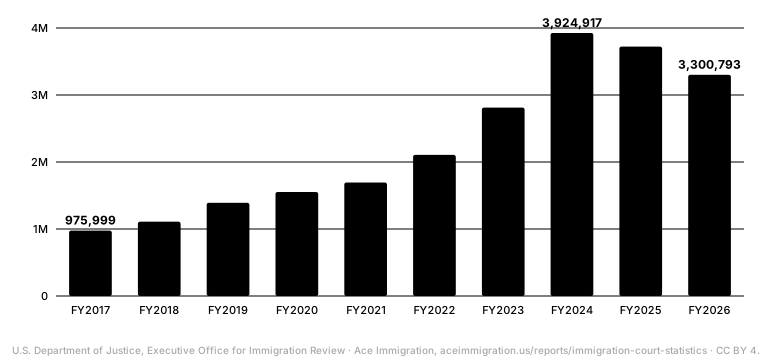
Show the data
| Fiscal year | Pending cases | New cases | Completions |
|---|---|---|---|
| FY2017 | 975,999 | 295,259 | 163,074 |
| FY2018 | 1,108,323 | 316,130 | 195,145 |
| FY2019 | 1,391,389 | 547,237 | 277,076 |
| FY2020 | 1,551,999 | 369,578 | 232,310 |
| FY2021 | 1,694,256 | 244,264 | 115,968 |
| FY2022 | 2,105,300 | 707,530 | 314,848 |
| FY2023 | 2,811,569 | 1,206,105 | 526,834 |
| FY2024 | 3,924,917 | 1,783,908 | 705,295 |
| FY2025 | 3,722,534 | 562,376 | 798,975 |
| FY2026 | 3,300,793 | 528,889 | 973,669 |
The decline is arithmetic, not relief: courts completed 973,669 cases in FY2026 while DHS filed 528,889 new ones. In FY2024 the ratio was reversed, with 1,783,908 new cases against 705,295 completions. Monthly completions averaged 73,371 in the first nine months of FY2026, against 58,771 in FY2024 (U.S. Department of Justice, Executive Office for Immigration Review).
Source: EOIR Adjudication Statistics: Pending Cases, New Cases, and Total Completions, data generated October 22, 2026
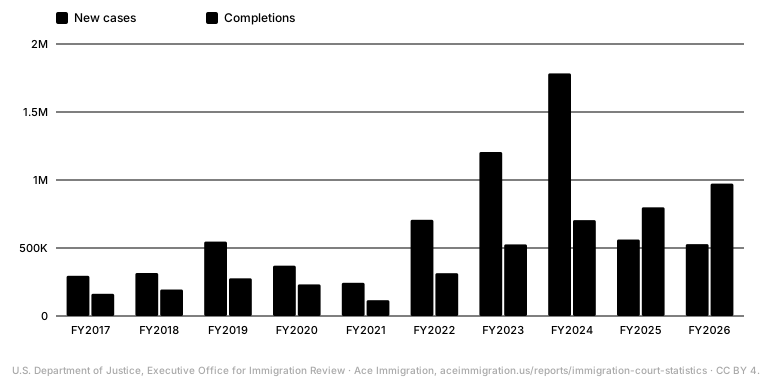
Show the data
| Fiscal year | New cases | Completions | Net change in backlog |
|---|---|---|---|
| FY2017 | 295,259 | 163,074 | 132,185 |
| FY2018 | 316,130 | 195,145 | 120,985 |
| FY2019 | 547,237 | 277,076 | 270,161 |
| FY2020 | 369,578 | 232,310 | 137,268 |
| FY2021 | 244,264 | 115,968 | 128,296 |
| FY2022 | 707,530 | 314,848 | 392,682 |
| FY2023 | 1,206,105 | 526,834 | 679,271 |
| FY2024 | 1,783,908 | 705,295 | 1,078,613 |
| FY2025 | 562,376 | 798,975 | -236,599 |
| FY2026 | 528,889 | 973,669 | -444,780 |
How cases end: three in four initial decisions are removal orders
From October 1, 2025 to June 30, 2026, immigration judges issued 641,503 initial decisions in removal, deportation and exclusion cases. 476,650 (74.3%) were removal orders, and 278,724 of those, 58.5% of all removal orders, were entered in absentia. Relief was granted in 13,899 cases (2.2%); another 1,487 people were ordered removed but protected from return under withholding of removal or the Convention Against Torture (U.S. Department of Justice, Executive Office for Immigration Review).
Source: EOIR Adjudication Statistics: FY 2026 Decision Outcomes, data generated July 24, 2026In absentia removals are a subset of removal orders. Initial case decisions in removal, deportation and exclusion cases (Form I-862).
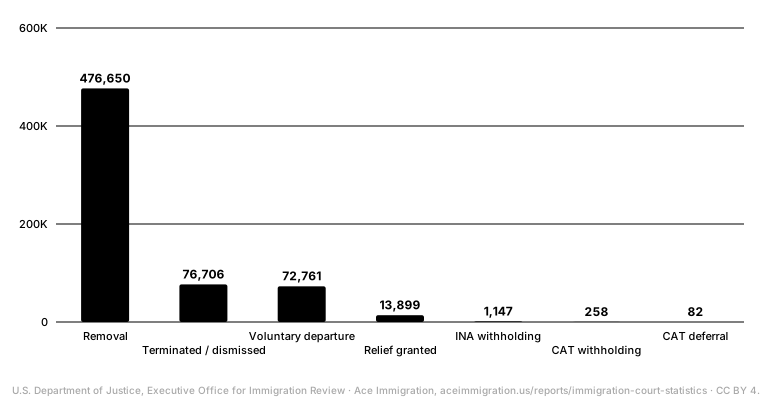
Show the data
| Outcome | Decisions | Share |
|---|---|---|
| Removal ordered | 476,650 | 74.3% |
| of which in absentia | 278,724 | 43.4% |
| Terminated or dismissed | 76,706 | 12.0% |
| Voluntary departure or withdrawal of application for admission | 72,761 | 11.3% |
| Relief granted | 13,899 | 2.2% |
| Removal with INA withholding granted | 1,147 | 0.2% |
| Removal with CAT withholding granted | 258 | 0.0% |
| Removal with CAT deferral | 82 | 0.0% |
| All initial decisions | 641,503 | 100% |
Terminations and dismissals (76,706) and voluntary departures or withdrawn applications for admission (72,761) together outnumber grants of relief five to one. A termination ends the court case without a removal order but grants no status; a voluntary departure order avoids a formal removal order but still requires leaving the country.
In absentia orders: 281,867 in nine months
Immigration judges entered 281,867 in absentia removal orders between October 1, 2025 and June 30, 2026, an average of 31,319 a month. That pace exceeds FY2025, which set the previous full-year record at 311,130 (25,928 a month), itself +806% above FY2016 (U.S. Department of Justice, Executive Office for Immigration Review). Among asylum applicants specifically, 90,288 in absentia orders were entered in the same nine months, against 50,254 in all of FY2025 (U.S. Department of Justice, Executive Office for Immigration Review).
Source: EOIR Adjudication Statistics: In Absentia Removal Orders, data generated July 24, 2026
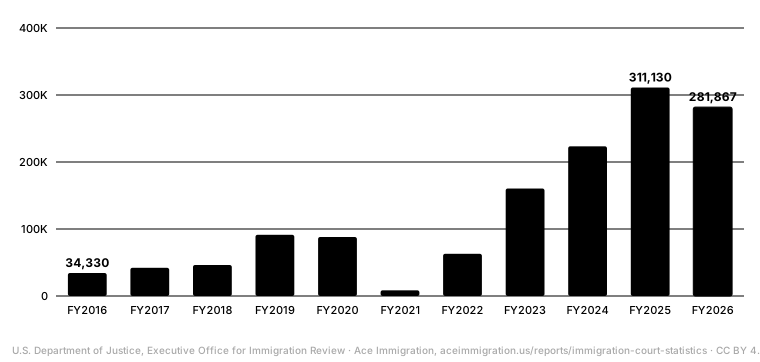
Show the data
| Fiscal year | In absentia orders | Per month | Of which released from custody |
|---|---|---|---|
| FY2016 | 34,330 | 2,861 | 9,759 |
| FY2017 | 42,061 | 3,505 | 11,533 |
| FY2018 | 46,237 | 3,853 | 12,198 |
| FY2019 | 91,389 | 7,616 | 15,827 |
| FY2020 | 88,001 | 7,333 | 7,745 |
| FY2021 | 8,556 | 713 | 1,589 |
| FY2022 | 62,916 | 5,243 | 10,260 |
| FY2023 | 160,504 | 13,375 | 23,926 |
| FY2024 | 223,502 | 18,625 | 18,262 |
| FY2025 | 311,130 | 25,928 | 16,003 |
| FY2026 (9 mo.) | 281,867 | 31,319 | 17,565 |
Representation: 45% face the judge without a lawyer
In FY2025, 143,614 of 263,133 completed cases (55%) had a representative of record, leaving 119,519 people unrepresented. In completed asylum cases the rate was 77%, and it was highest, 89%, in cases of unaccompanied children (U.S. Department of Justice, Executive Office for Immigration Review). Immigration court is civil, so there is no right to appointed counsel.
Source: EOIR Adjudication Statistics: Current Representation Rates, data generated November 18, 2025Excludes in absentia orders, terminations and dismissals. A lawyer who has not filed Form EOIR-28 counts as unrepresented.

Show the data
| Universe | Represented | Unrepresented | Total | Rate |
|---|---|---|---|---|
| All completed cases | 143,614 | 119,519 | 263,133 | 55% |
| Completed asylum cases | 186,821 | 56,316 | 243,137 | 77% |
| Unaccompanied children | 10,441 | 1,240 | 11,681 | 89% |
| Case appeals (BIA) | 18,292 | 5,782 | 24,074 | 76% |
Judges and appeals: 753 judges, 325,774 pending appeals
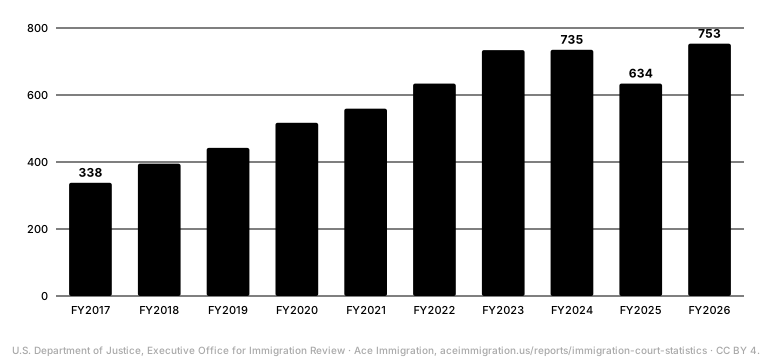
EOIR had 753 immigration judges on board at the end of FY2026 after hiring 312 during the year, the largest intake in the series; in FY2025 it hired 14 and the corps fell to 634 (U.S. Department of Justice, Executive Office for Immigration Review). Immigration courtrooms grew from 336 in 2015 to 642 in 2024 (U.S. Department of Justice, Executive Office for Immigration Review). With 3,300,793 pending cases, each judge carries roughly 4,384 cases.
Source: EOIR Adjudication Statistics: Immigration Judge (IJ) Hiring, data generated October 2026Reemployed annuitants included; temporary immigration judges excluded (36 on board on September 30, 2026).
Show the data
| Fiscal year | Judges hired | Judges on board |
|---|---|---|
| FY2017 | 64 | 338 |
| FY2018 | 81 | 395 |
| FY2019 | 92 | 442 |
| FY2020 | 99 | 517 |
| FY2021 | 65 | 559 |
| FY2022 | 104 | 634 |
| FY2023 | 133 | 734 |
| FY2024 | 46 | 735 |
| FY2025 | 14 | 634 |
| FY2026 | 312 | 753 |
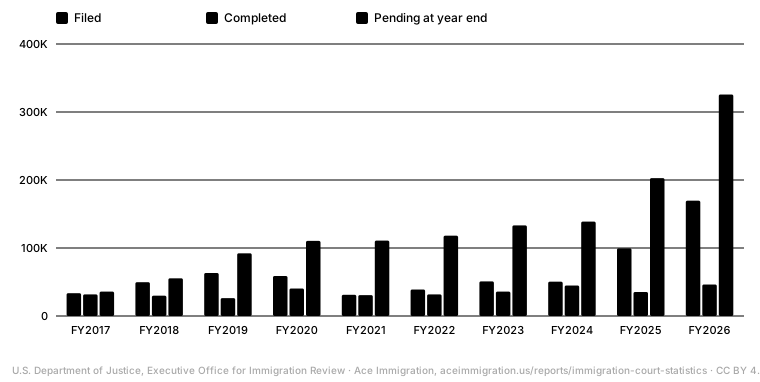
The Board of Immigration Appeals ended FY2026 with 325,774 appeals pending, up from 138,817 two years earlier. Appeals filed reached 169,538 in FY2026, +236% more than in FY2024, while the Board completed 46,374 (U.S. Department of Justice, Executive Office for Immigration Review).
Source: EOIR Adjudication Statistics: All Appeals Filed, Completed, and Pending, data generated October 22, 2026
Show the data
| Fiscal year | Filed | Completed | Pending |
|---|---|---|---|
| FY2017 | 33,564 | 31,820 | 35,837 |
| FY2018 | 49,646 | 29,790 | 55,481 |
| FY2019 | 63,235 | 26,271 | 92,255 |
| FY2020 | 58,838 | 40,393 | 110,489 |
| FY2021 | 31,240 | 30,727 | 110,857 |
| FY2022 | 38,901 | 31,763 | 118,122 |
| FY2023 | 50,867 | 35,882 | 133,167 |
| FY2024 | 50,432 | 44,785 | 138,817 |
| FY2025 | 99,594 | 35,362 | 202,819 |
| FY2026 | 169,538 | 46,374 | 325,774 |
Motions and adjournments: the second chances, and the delays
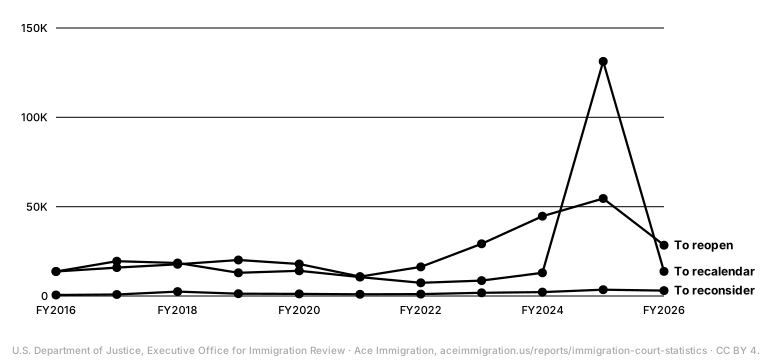
Motions to reopen reached 54,557 in FY2025, four times the FY2016 figure, and 28,437 were filed in the first nine months of FY2026. Motions to recalendar, which ask a court to put an administratively closed case back on the docket, spiked to 131,290 in FY2025 as DHS moved to reopen closed cases (U.S. Department of Justice, Executive Office for Immigration Review).
Source: EOIR Adjudication Statistics: Motions, data generated July 24, 2026
Show the data
| Fiscal year | Motions to reopen | Motions to recalendar | Motions to reconsider | BIA motions |
|---|---|---|---|---|
| FY2016 | 13,720 | 13,696 | 540 | 5,641 |
| FY2017 | 15,896 | 19,450 | 847 | 5,898 |
| FY2018 | 17,760 | 18,478 | 2,447 | 7,658 |
| FY2019 | 20,147 | 13,003 | 1,304 | 5,568 |
| FY2020 | 17,887 | 14,088 | 1,148 | 4,993 |
| FY2021 | 10,877 | 10,565 | 977 | 5,784 |
| FY2022 | 16,265 | 7,379 | 1,047 | 4,522 |
| FY2023 | 29,203 | 8,630 | 1,819 | 5,097 |
| FY2024 | 44,662 | 13,008 | 2,181 | 7,197 |
| FY2025 | 54,557 | 131,290 | 3,548 | 7,643 |
| FY2026 (9 mo.) | 28,437 | 13,795 | 3,021 | 4,600 |
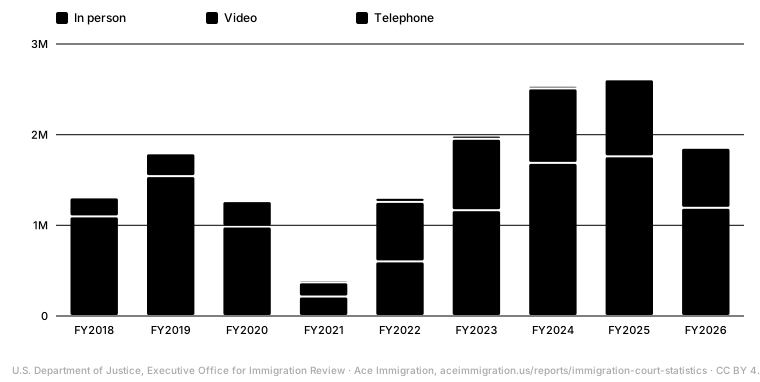
Hearings were adjourned 2,622,342 times in FY2025 and 1,860,166 times in the first nine months of FY2026; video hearings accounted for 36% of adjourned hearings in FY2026 (U.S. Department of Justice, Executive Office for Immigration Review). Each adjournment is a hearing that did not decide the case.
Source: EOIR Adjudication Statistics: Hearing Adjournments by Medium and Fiscal Year, data generated July 24, 2026All hearing types; the total excludes adjournments recorded without a medium.
Show the data
| Fiscal year | In person | Video | Telephone | Total |
|---|---|---|---|---|
| FY2018 | 1,098,827 | 209,617 | 12,917 | 1,321,361 |
| FY2019 | 1,542,634 | 251,772 | 11,304 | 1,805,710 |
| FY2020 | 987,142 | 280,521 | 11,979 | 1,279,642 |
| FY2021 | 214,810 | 156,332 | 25,726 | 396,868 |
| FY2022 | 602,725 | 656,171 | 44,869 | 1,303,765 |
| FY2023 | 1,166,646 | 787,526 | 35,462 | 1,989,634 |
| FY2024 | 1,688,161 | 822,601 | 28,080 | 2,538,842 |
| FY2025 | 1,761,173 | 849,629 | 11,540 | 2,622,342 |
| FY2026 (9 mo.) | 1,193,697 | 661,740 | 4,729 | 1,860,166 |
- Pending detained cases had a median age of 63 days at the end of FY2024, down from 554 in FY2021 (U.S. Department of Justice, Executive Office for Immigration Review).
- Between January 20 and June 30, 2025 the pending docket fell by 391,032 cases, from 4,173,595 to 3,782,563 (U.S. Department of Justice, Executive Office for Immigration Review).
How to read these numbers
- Pending case
- A removal, deportation, exclusion, asylum-only or withholding-only case open at the end of the fiscal year, whether or not a hearing is scheduled.
- Initial receipt and completion
- A receipt is a new case filed by DHS with the court. A completion is a decision that closes a case; total completions also count subsequent completions, for example after a motion to reopen.
- In absentia removal order
- A removal order entered because the respondent did not appear at a hearing after notice. It can be reopened only in limited circumstances, such as lack of notice or exceptional circumstances.
- Representation rate
- The share of completed cases in which a lawyer or accredited representative filed Form EOIR-28. Someone with a lawyer who has not filed the form counts as unrepresented.
- Fiscal year
- October 1 to September 30. FY2026 ran from October 1, 2025 to September 30, 2026; outcome tables generated in July 2026 cover its first nine months.
Sources and method
Every figure on this page comes from a file published by the U.S. government, retrieved October 31, 2026. The tables were extracted from the original PDF and Excel files by scripts that check each table against the totals printed in the same file (row sums, recomputed rates, fiscal-year sequences). Derived measures such as approval shares and year-over-year changes are computed from the published counts, and the formula is stated next to each one.
The federal fiscal year starts on October 1: FY2026 runs from October 1, 2025 to September 30, 2026. Partial years are marked. Agencies suppress small cells to protect privacy; those cells are shown as “—” and left out of sums, which explains small gaps against national totals.
- EOIR Adjudication Statistics: Pending Cases, New Cases, and Total Completions
U.S. Department of Justice, Executive Office for Immigration Review · data generated October 22, 2026 · agency page
- EOIR Adjudication Statistics: New Cases and Total Completions
U.S. Department of Justice, Executive Office for Immigration Review · data generated July 24, 2026 · agency page
- EOIR Adjudication Statistics: FY 2026 Decision Outcomes
U.S. Department of Justice, Executive Office for Immigration Review · data generated July 24, 2026 · agency page
- EOIR Adjudication Statistics: In Absentia Removal Orders
U.S. Department of Justice, Executive Office for Immigration Review · data generated July 24, 2026 · agency page
- EOIR Adjudication Statistics: Asylum Applicant In Absentia Removal Orders
U.S. Department of Justice, Executive Office for Immigration Review · data generated July 24, 2026 · agency page
- EOIR Adjudication Statistics: Current Representation Rates
U.S. Department of Justice, Executive Office for Immigration Review · data generated November 18, 2025 · agency page
- EOIR Adjudication Statistics: Immigration Judge (IJ) Hiring
U.S. Department of Justice, Executive Office for Immigration Review · data generated October 2026 · agency page
- EOIR Adjudication Statistics: Number of Courtrooms
U.S. Department of Justice, Executive Office for Immigration Review · data generated October 2024 · agency page
- EOIR Adjudication Statistics: All Appeals Filed, Completed, and Pending
U.S. Department of Justice, Executive Office for Immigration Review · data generated October 22, 2026 · agency page
- EOIR Adjudication Statistics: Motions
U.S. Department of Justice, Executive Office for Immigration Review · data generated July 24, 2026 · agency page
- EOIR Adjudication Statistics: Hearing Adjournments by Medium and Fiscal Year
U.S. Department of Justice, Executive Office for Immigration Review · data generated July 24, 2026 · agency page
- EOIR Adjudication Statistics: Pending Cases, New Cases, and Total Completions - Last 12 Months
U.S. Department of Justice, Executive Office for Immigration Review · data generated August 4, 2025 · agency page
- EOIR Adjudication Statistics: Median Times for Pending Detained Cases
U.S. Department of Justice, Executive Office for Immigration Review · data generated October 10, 2024 · agency page
General information, not legal advice. Statistics describe groups of cases, not yours: an outcome depends on the facts, the evidence, the court and the governing law. Publication does not create an attorney-client relationship.
Do you have a Notice to Appear or a hearing date?
A missed hearing is counted in the numbers above as a removal order. Tell us your court, your A-number and your next date; attorney Anna Tsibel reviews removal cases in all 50 states, in English and Russian.
We take these cases: Asylum, Deportation and removal defense, Family and marriage-based immigration, K-1 fiancé(e) visa, I-751 removal of conditions and waivers, Inadmissibility waivers, VAWA self-petitions, Citizenship and naturalization.
(805) 409-9384